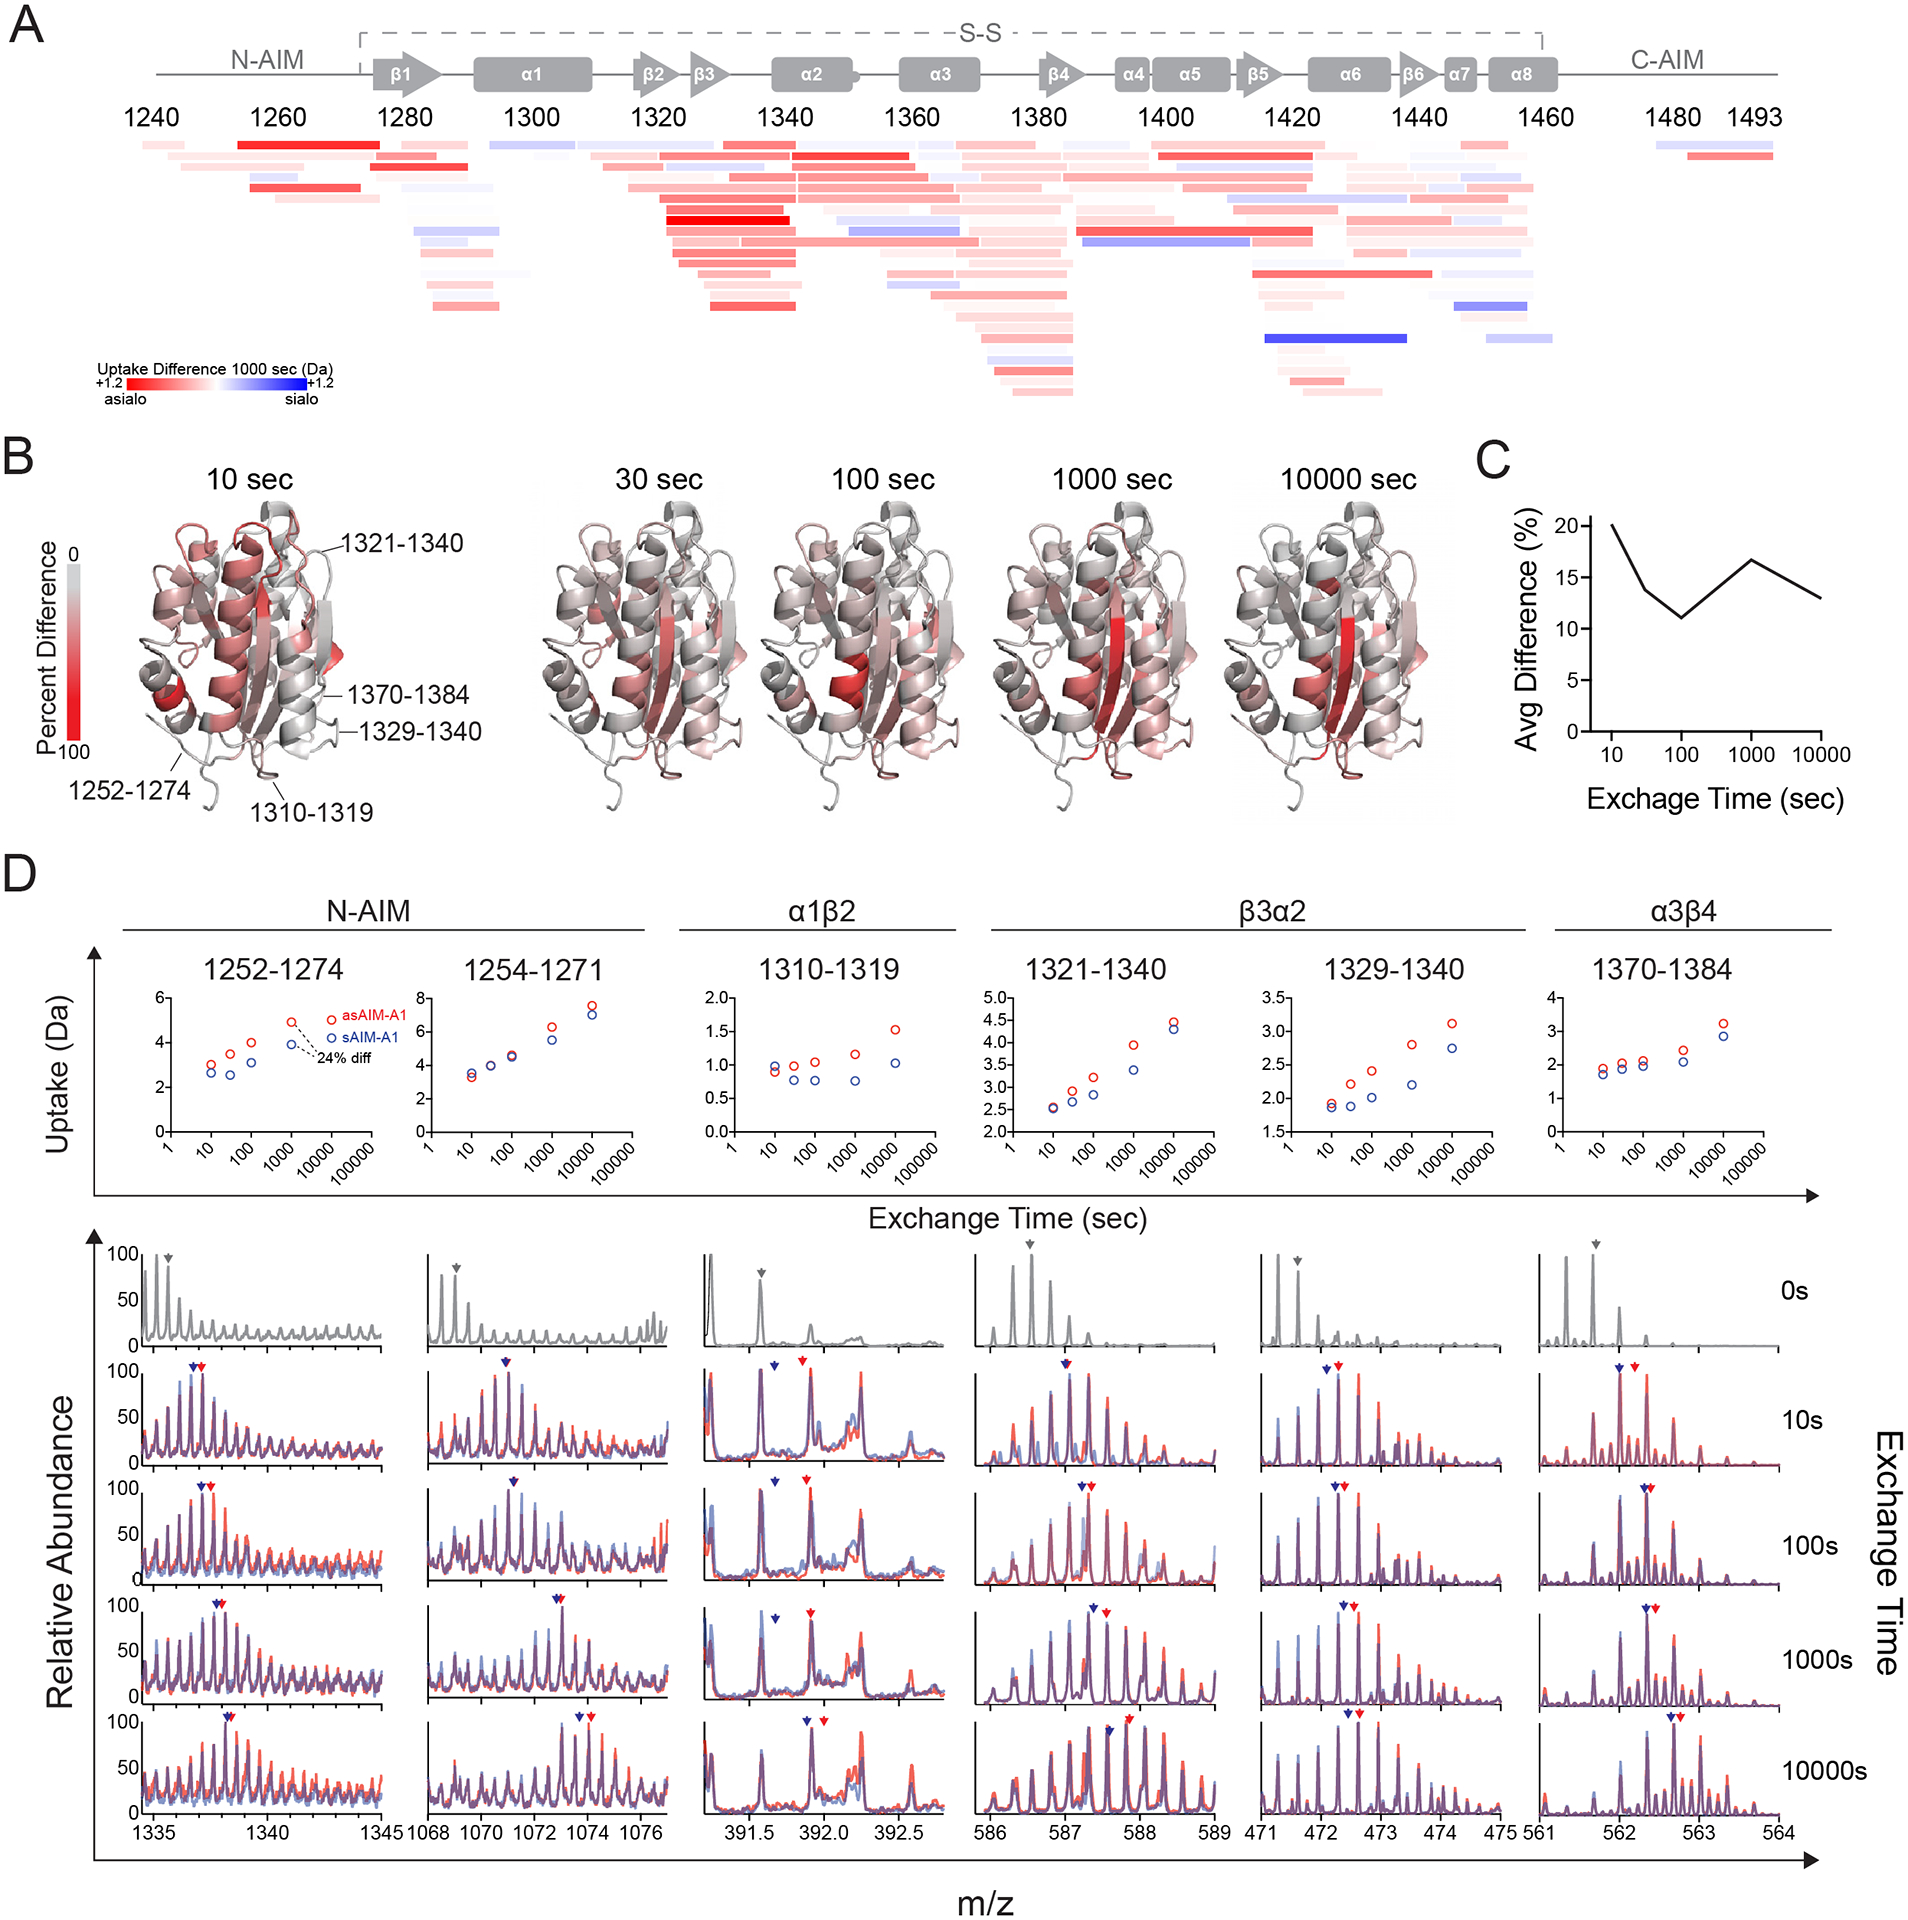
Figure 6. HDX of asialo-AIM-A1 reveals increased exposure of the residues around the GPIbα-binding site and N-AIM.

(A) Heatmap plot showing the difference in relative fractional deuterium uptake between peptic fragments of sAIM-A1 and asAIM-A1 after exchange for 1,000 s. Each peptide is placed by its starting and ending residue numbers in VWF. Peptide color reflects the difference in deuterium uptake as indicated. Red indicates increases in uptake for asAIM-A1 peptides. (B) Ribbon diagrams of A1 domain (PDB: 1sq0) showing percent difference in deuterium uptake between sAIM-A1 and asAIM-A1 at indicated exchange timepoints. Residues in the structure are colored according to the gray_to_red spectrum color palette. (C) Average percent difference across the A1 domain measured over time. (D) Deuterium uptake plots (upper panel) and overlaid mass spectra (lower panels) for representative peptic fragments. Each fragment is identified by its starting and ending residue numbers. Spectra in gray are those collected without deuterium exchange. Blue and red spectra are of fragments from sAIM-A1 and asAIM-A1, respectively. Blue and red arrowheads indicate the centroid mass of each fragment in the like-colored mass spectra.
