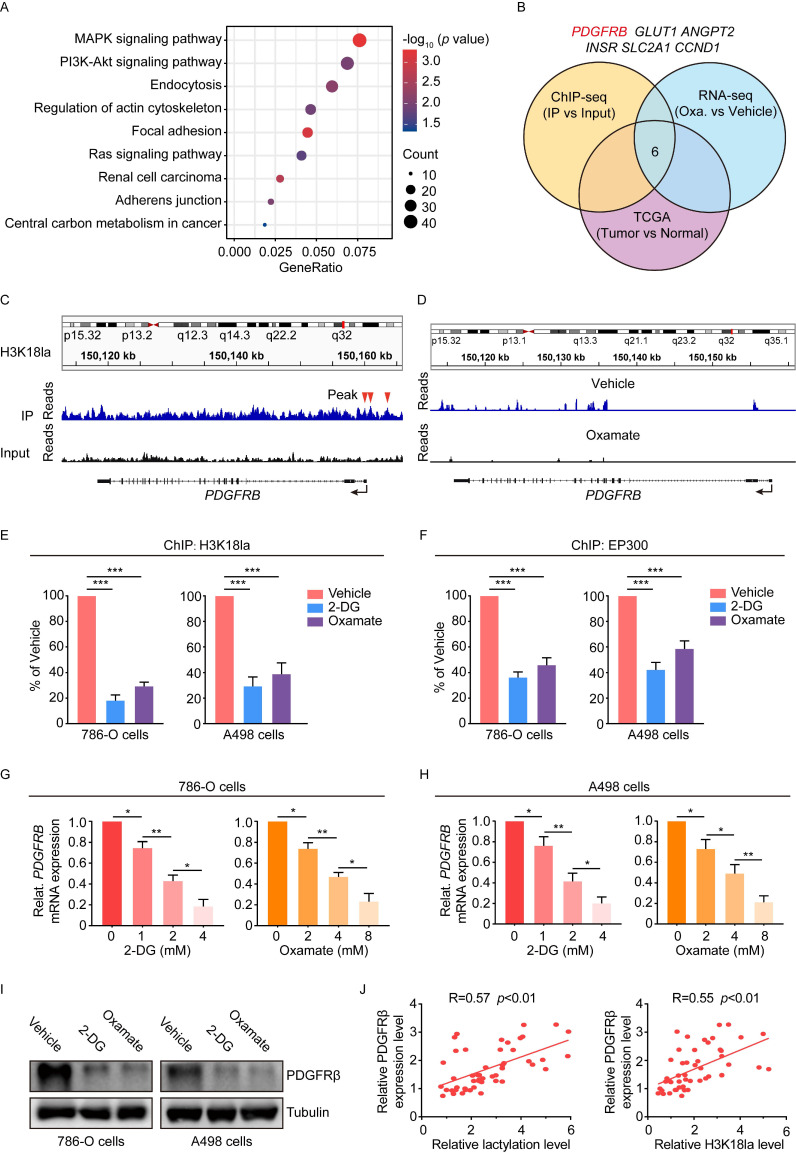
Figure 4.
Histone lactylation transcriptionally activates PDGFRβ. (A) KEGG analysis of H3K18la peaks revealed by chromatin immunoprecipitation sequencing (ChIP-seq) of 786-O cells. (B) Strategy to identify potential specific downstream targets of histone H3K18la modification. (C) Representative IGV tracks showing enriched H3K18la modification in PDGFRB promotor by ChIP-seq. Arrows are the H3K18la peaks at the PDGFRB promotor. (D) Representative IGV tracks showing decreased PDGFRB expression upon oxamate treatment by RNA-seq. (E) ChIP-qPCR analysis for H3K18la status at the PDGFRB promotor of 786-O (left panel) an A498 (right panel) cells treated with 4mM 2-DG or 8mM oxamate for 24h. (F) ChIP-qPCR analysis for EP300 status at the PDGFRB promotor of 786-O (left panel) an A498 (right panel) cells treated with 4mM 2-DG or 8mM oxamate for 24h. (G, H) mRNA expression levels of PDGFRB in 786-O cells (G) and A498 cells (H) treated with indicated concentrations of 2-DG (left panel) or oxamate (right panel) for 24h as determined by RT-qPCR. (I) Western blot showing the expression of PDGFRβ in 786-O (left panel) and A498 (right panel) cells treated with 4mM 2-DG or 8mM oxamate for 24h. (J) Correlation between PDGFRβ expression levels and global lactylation (left panel) or H3K18la (right panel) levels in ccRCC patients. Data are presented as mean±SD. *p<0.05, **p<0.01, ***p<0.001, by 1-way ANOVA (E, F, G, H) or Person's correlation analysis (J).

