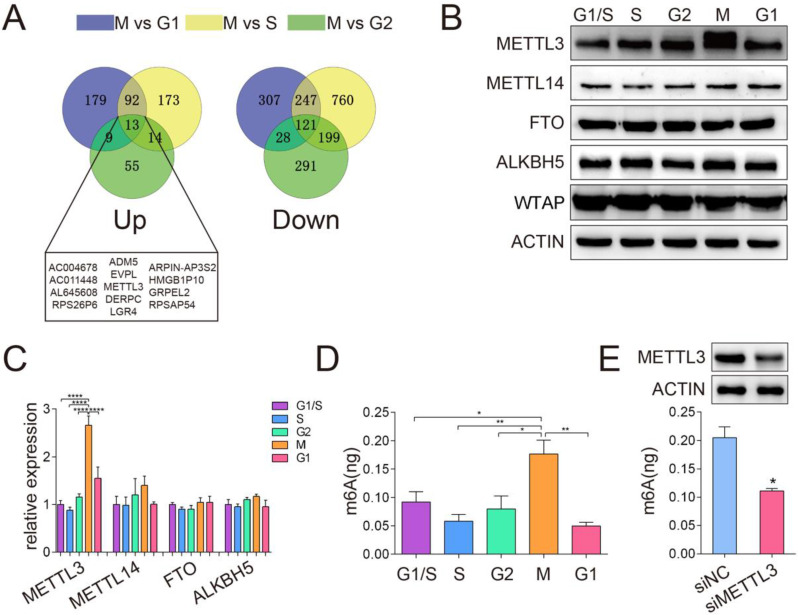
Figure 1.
METTL3 expression was elevated and correlated with high m6A levels in the M phase. (A) Venn diagram illustrated the upregulated and downregulated genes differentially expressed in the M phase compared to other cell cycle phases (G1 phase, S phase and G2 phase). (B) The protein levels of METTL3, METTL14, FTO, ALKBH5 and WTAP were analyzed by Western blotting. ACTIN served as a loading control. (C) The relative mRNA levels of METTL3, METTL14, FTO and ALKBH5 were analyzed by qPCR. **** P < 0.0001 (one-way ANOVA analysis) for the indicated comparisons. Relative mRNA expression levels were normalized by 18S rRNA. Data are presented as the mean ± SD for n = 3 replicate cultures. (D) Global m6A mRNA methylation levels in various HeLa cell cycle phases were determined by m6A enzyme-linked immunosorbent assays. m6A RNA methylation quantification was performed based on the standard curve. * P < 0.05, ** P < 0.01 (one-way ANOVA analysis) for the indicated comparisons. (E) Quantification of m6A enrichment in mRNA from control and siMETTL3 cells in the M phase. The knockdown efficiency of METTL3 in HeLa cells was confirmed by Western blotting indicated in the upper panel. Quantification of m6A was detected by the m6A RNA methylation quantification kit. Data shown are mean ± SD for n = 3 replicate cultures, * P < 0.05 compared to negative control. (The western blotting data are representative of n=3 independent experiments).

