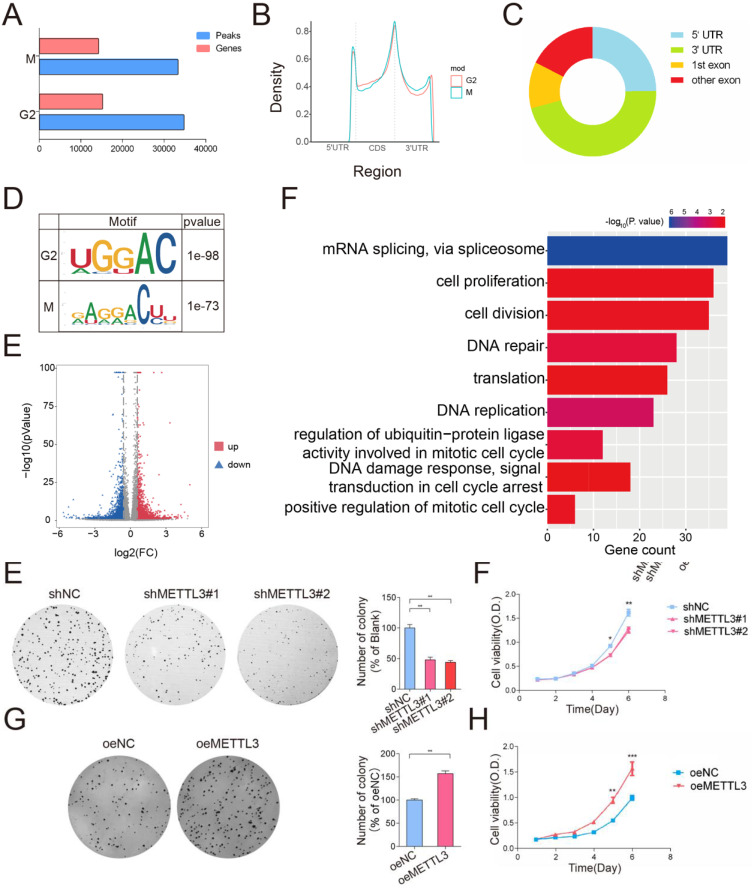
Figure 3.
m6A -seq analysis of cells in the M and G2 phases. (A)The eluted RNA and MeRIPed RNA from HeLa cells at M or G2 phases were analyzed by deep sequencing. Bar plot showing the numbers of m6A peaks and m6A -modified genes in the M and G2 phases. (B) Density distribution of the m6A peak across mRNA transcripts. m6A peak distribution in the 5′UTR, start codon, CDS, stop codon or 3′UTR region across the entire set of mRNA transcripts. (C) Regions of the 5′ untranslated region (5′UTR), coding region (CDS), and 3′untranslated region (3′UTR) were split into 100 segments, then percentages of m6A peaks that fall within each segment were determined. Pie chart showing the different m6A peak distribution between the 5'UTR, exon and 3'UTR regions. (D) Predominant consensus motif GGAC was detected in both G2 phase and M phase in m6A-seq. (E) Volcano plot showing the distribution of genes with differential m6A levels in the M phase groups compared with the G2 phase group. (F) Gene ontology (GO) analysis of genes with increased m6A methylation levels (Fold Change > 2; P < 0.05 in m6A-seq) in the M phase compared to the G2 phase. Gene counts of GO terms were exhibited on the x-axis and p-values were indicated with the color of columns.

