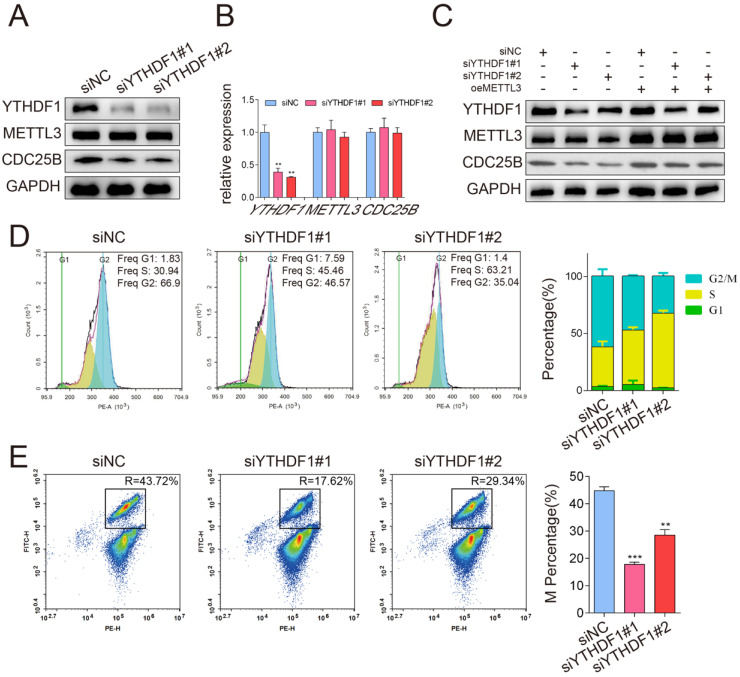
Figure 5.
YTHDF1 enhanced CDC25B mRNA translation in an m6A -dependent manner. (A) Western blotting of METTL3 and CDC25B after YTHDF1 inhibition in HeLa cells. GAPDH served as a loading control. (B) RT-qPCR analysis of METTL3 and CDC25B mRNA expression after YTHDF1 inhibition in HeLa cells. Data shown are mean fold-change values ± SD for n = 3 replicate cultures. ** P < 0.01 (one-way ANOVA analysis) compared to the negative control (siNC) group. (C) Analysis of the CDC25B protein expression in HeLa cells co-transfected with YTHDF1 siRNA and METTL3 plasmid. GAPDH served as a loading control. (D) Changes in the cell cycle after knockdown of YTHDF1 were detected with flow cytometry. The percentage of cells in the G1, S and G2/M phases were calculated using FACS software and data were shown in each image on the left panel. The average percentage of cells in the G1, S and G2/M phases from 3 independent experiments was shown by a stacked bar chart at the right panel. (E) The percentage of cells in the M phase after knockdown of YTHDF1 was detected by phospho-H3-specific flow cytometry. The percentage of cells in the M phases showed in each image on the left panel. The average percentage of cells in the M phases from 3 independent experiments was shown by a stacked bar chart on the right panel. Data shown are mean values ± SD for n = 3 replicate cultures. ** P < 0.01, *** P < 0.001 (one-way ANOVA analysis) compared to the negative control (siNC) group. (The western blotting data are representative of n=3 independent experiments).

