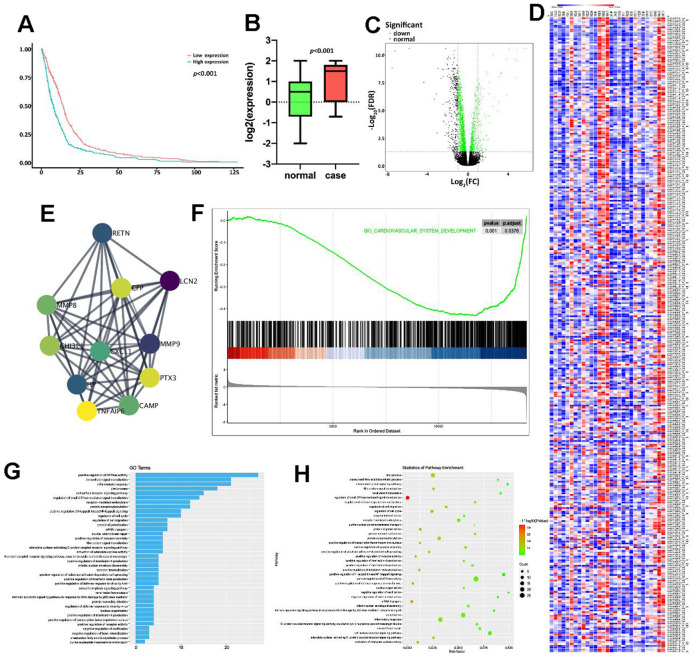
Figure 1.
Bioinformatics analysis indicated the potential association between PTX3 and HF progression. (A) Kaplan-Meier analysis in GEO database showed that the up-regulation of PTX3 was associated with a lower overall survival rate. (B) PTX3 in tissues from HF patients was up-regulated compared with that in normal tissues. (C) Volcano plot and (D) heatmap of the PTX3-induced DEGs; red indicates the up-regulated genes and blue indicates the down-regulated genes. (E) Protein-protein interaction network of DEGs. (F) GSEA showed a significant correlation between PTX3 expression and the pathways related to IL-6 production. (G) GO analysis and (H) KEGG analysis revealed the representative enrichment pathways.

