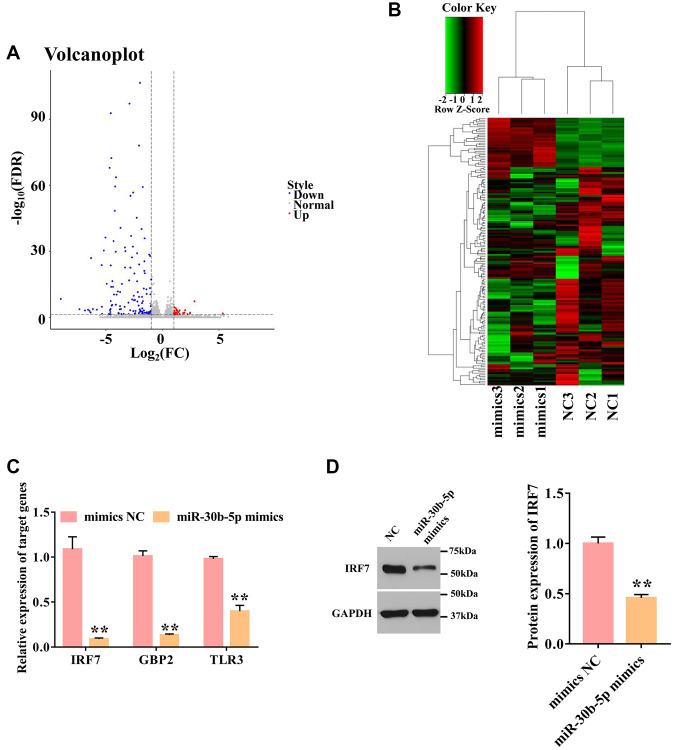
Figure 5.
Overexpression of miR-30b-5p down-regulates IRF7. (A) Volcano plot of differentially expressed genes. The red dot represents up-regulated genes, and the blue dot represents down-regulated genes. (B) Cluster heatmap of differentially expressed genes. Each column represents a sample; the row shaded in red represents up-regulated genes, and shaded in green represents down-regulated genes. (C) Validation of 3 selected targeted genes by qPCR. GAPDH was used as an internal control. (n = 3) (D) The protein expression level of IRF7 was detected by Western blotting. **P < 0.01.

