Figure 2.

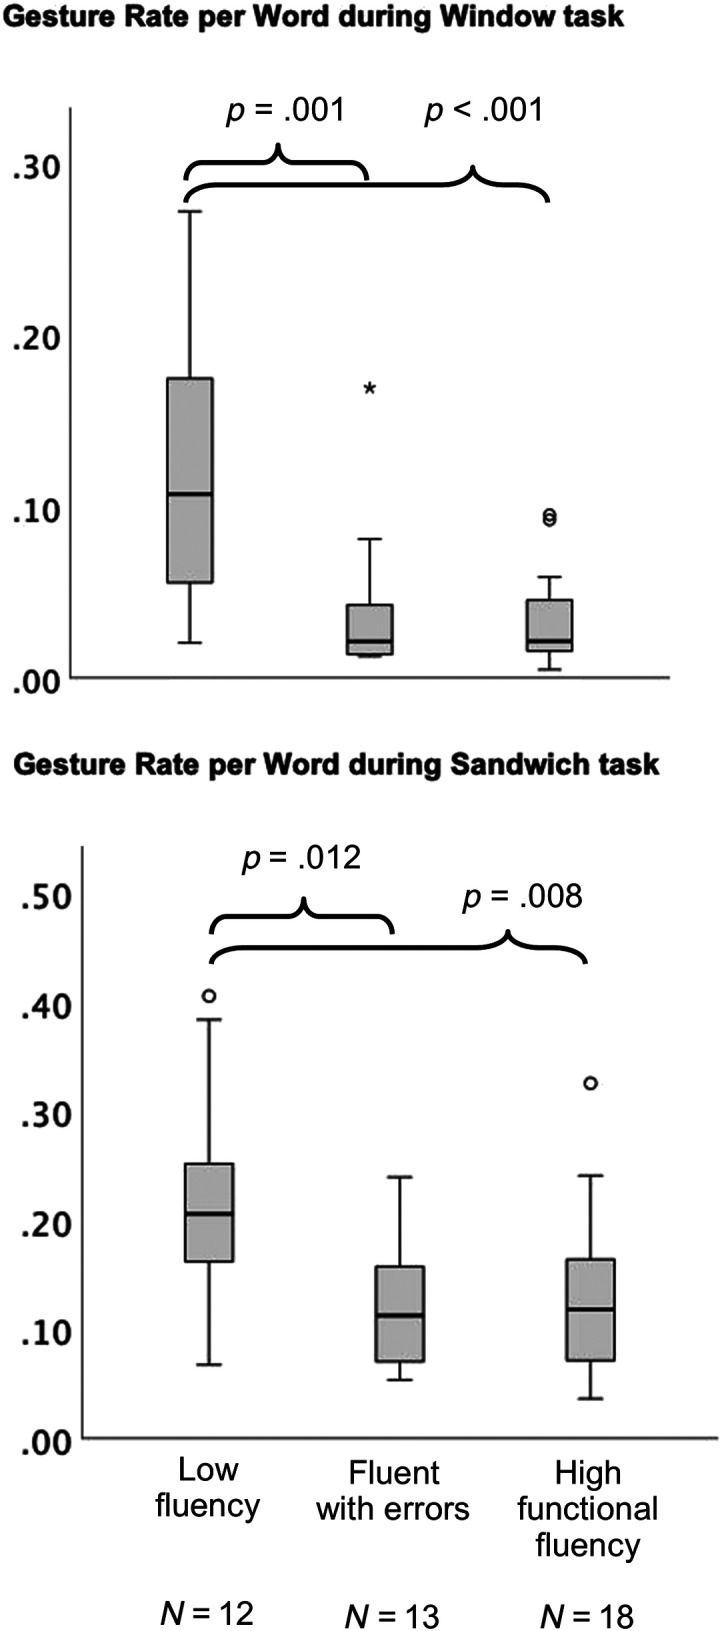
Pairwise comparisons of gesture rate by fluency group, during the Window task (top) and the Sandwich task (bottom), for subgroup of subjects who made at least one iconic gesture on both tasks (N = 43).

Pairwise comparisons of gesture rate by fluency group, during the Window task (top) and the Sandwich task (bottom), for subgroup of subjects who made at least one iconic gesture on both tasks (N = 43).