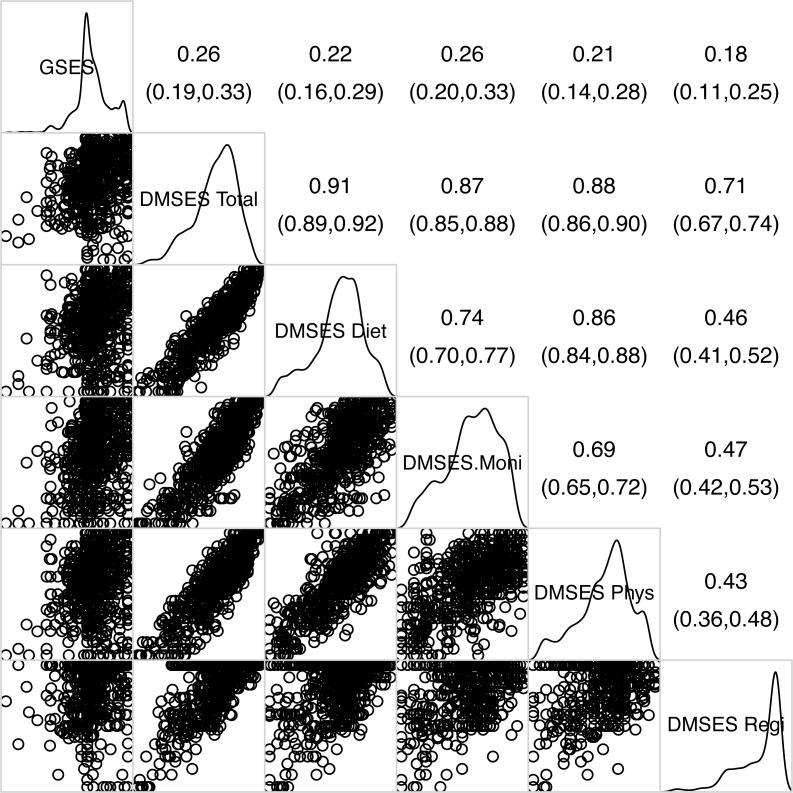
Figure 1. Corrgram of general- and diabetes management self-efficacy(sub)scales.
The upper triangle provides estimates of Pearson’s correlation coefficient along with their 95% confidence intervals, the lower triangle provides the scatter plots illustrating the pairwise relationships among the various scales, and the main diagonal provides the densities showing the distribution of each scale.

