
Figure 2.
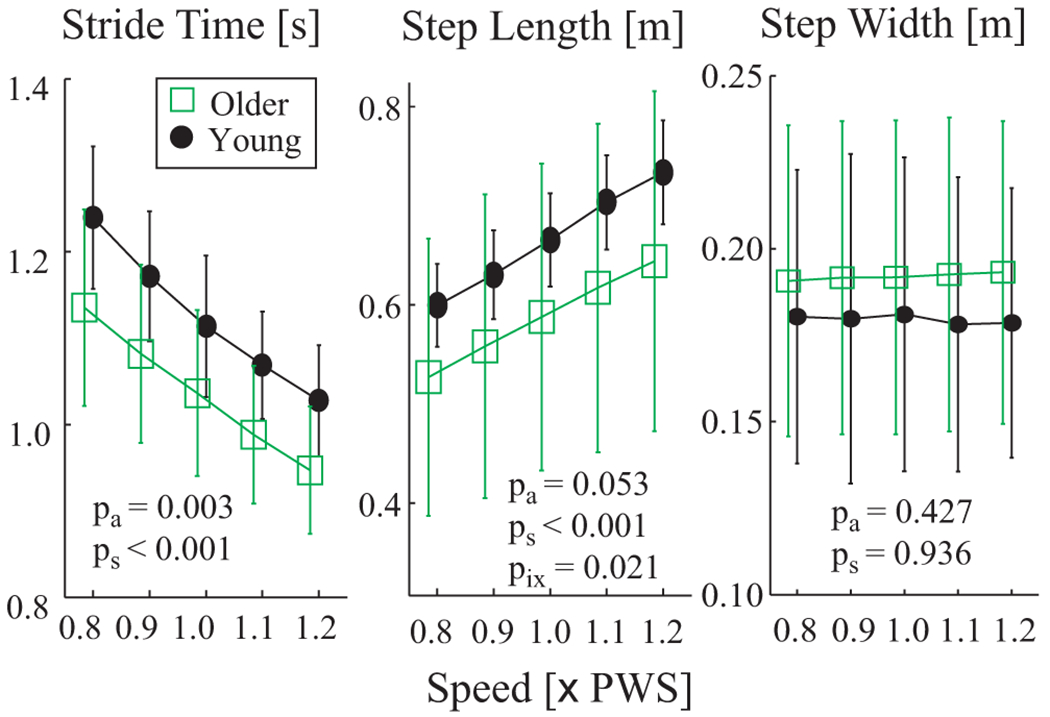
Spatio-temporal gait metrics vs. walking speed. 1.0×PWS is preferred walking speed. Error bars denote between-subject standard deviations within each group. Note that symbols for Older and Young groups have been offset slightly for clarity. ANOVA results for differences between age groups (pa), walking speeds (ps) and group × speed interactions (pix) are shown. Older adults exhibited shorter stride times at all 5 walking speeds. They also exhibited slightly shorter step lengths, but the differences did not quite reach statistical significance.