
Figure 4.
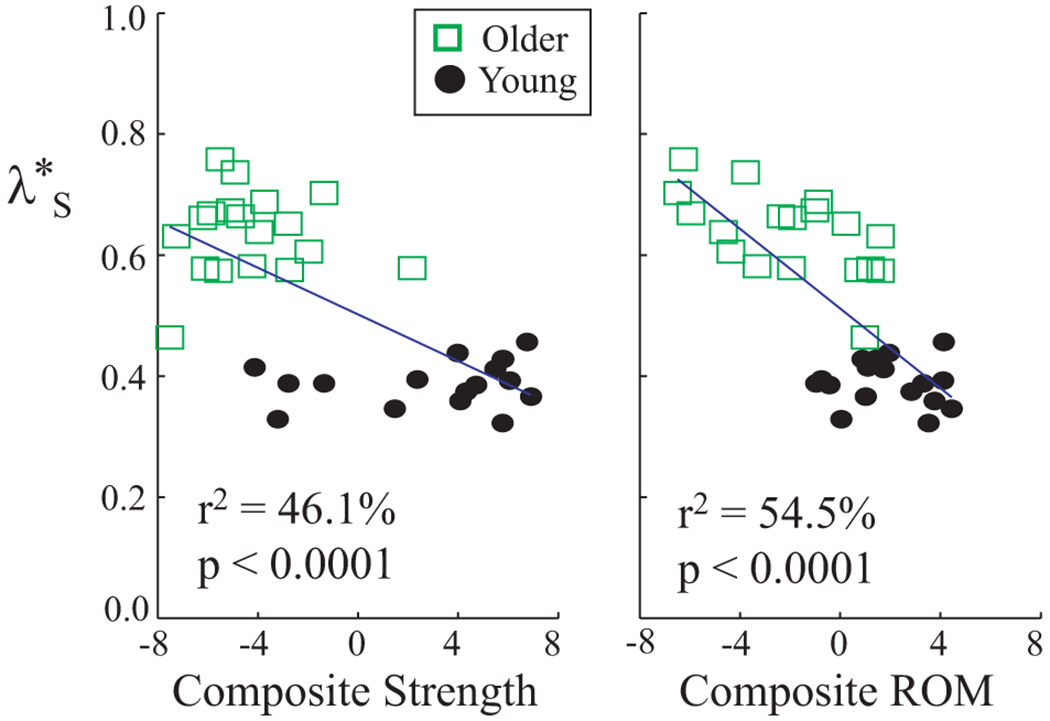
Short-term local divergence exponents (λ*S) vs. composite strength and range of motion (ROM) scores. Each symbol represents that average value for one subject, averaged across speeds. Composite strength and ROM scores were both correlated with λ*S. These correlations explain some, but not all, of the age-related differences in λ*S (Table 2).