
Figure 5.
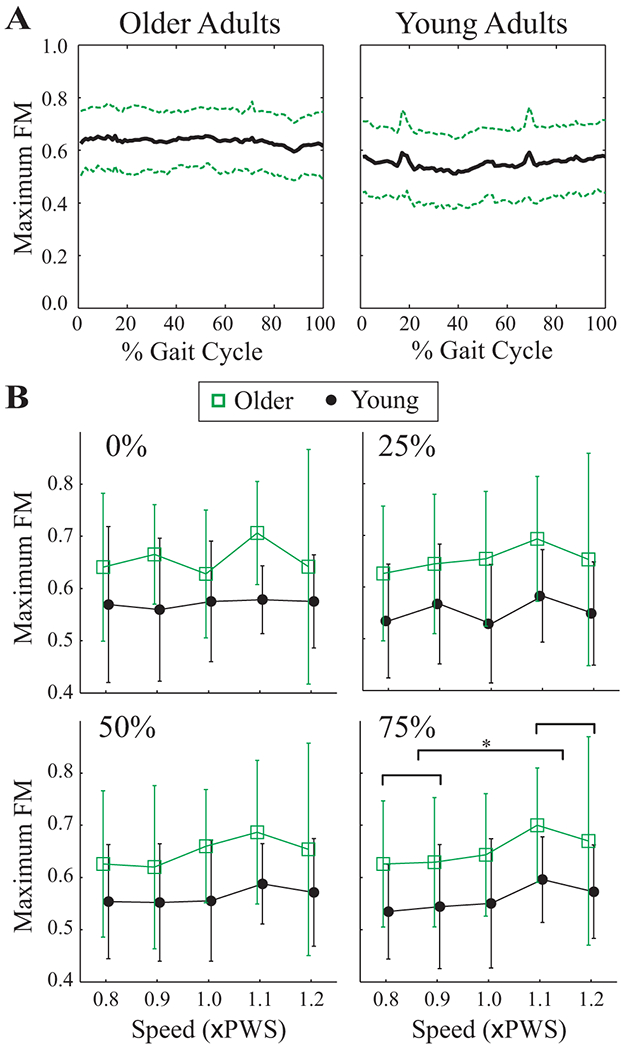
A) Maximum Floquet multipliers (FM) across the entire gait cycle for the 1.0×PWS walking speed for each age group. Solid lines are group averages. Dashed lines indicate ±1 between-subject standard deviation bands. Maximum FM were consistent across the gait cycle. A few trials displayed a spike at ~20% or ~70% of the gait cycle, but this was not consistent between subjects or groups. Similar results were obtained at the other walking speeds. B) Maximum FM values vs. Speed for both age groups for the Poincaré sections at 0%, 25%, 50% and 75% of the gait cycle. Error bars denote ±1 between-subject standard deviation within each group. Note that symbols for Older and Young groups have been offset slightly for clarity. Older adults (squares) displayed higher Maximum FM. The horizontal bracket at the 75% Poincaré section denotes significant Tukey’s LSD post-hoc comparisons at p < 0.005. Maximum FM at the 0.8× and 0.9×PWS speeds were significantly different from those at both the 1.1× and 1.2×PWS speeds.