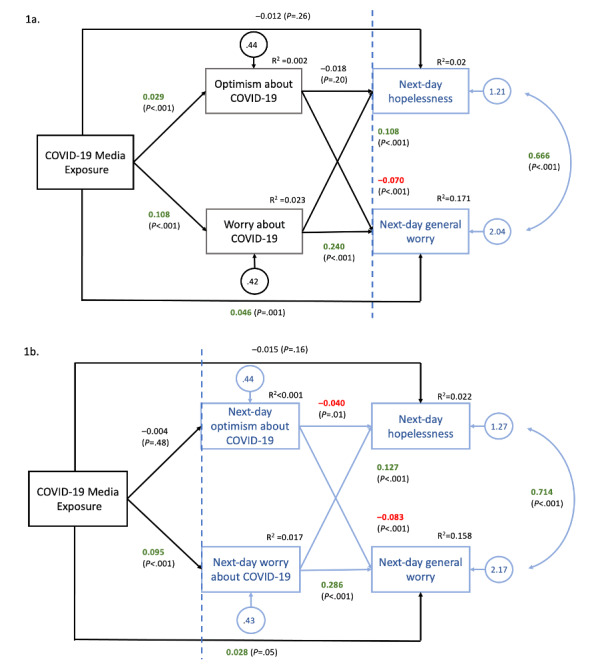
Figure 1.

Temporal multilevel mediation models with next-day effects. Note: the vertical dashed line indicates the break between consecutive days of data (ie, boxes shown in the same color represent data collected on the same day). Models show the effect of variables at time T (outlined in black) on variables the following day (T+1; outlined in blue). Coefficients in green indicate a positive relationship; coefficients in red indicate a negative relationship.
