Figure 2.

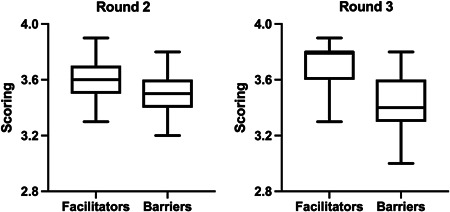
Box plots of Delphi rounds 2 and 3 mean scorings, split for facilitators and barriers. Box reports median, first and third quartile, and whiskers represent min and max scores

Box plots of Delphi rounds 2 and 3 mean scorings, split for facilitators and barriers. Box reports median, first and third quartile, and whiskers represent min and max scores