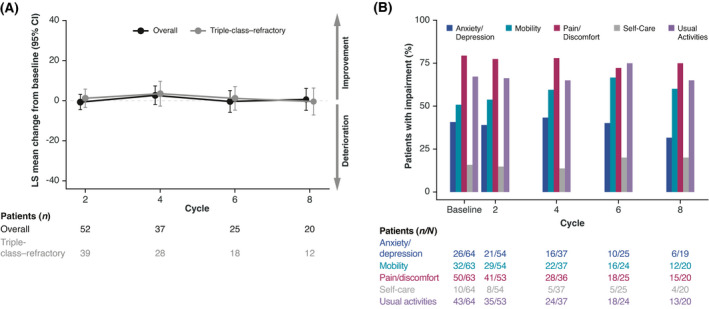
Fig 1.

EQ‐5D‐3L change from baseline and proportion of patients with impairments as assessed by EQ‐5D‐3L domains over treatment cycles. (A) LS mean change from baseline in EQ visual analogue scale over time for the overall group (black) and triple‐class–refractory subgroup (grey). Numbers underneath (A) and denominators underneath (B) represent non‐missing patients who completed the patient‐reported outcome measure in each respective cycle. (B) Proportion of total patients with detectable impairments in EQ‐5D‐3L scales per treatment cycle. CI, confidence interval; EQ‐5D‐3L, EuroQol five Dimensions‐three Levels. [Colour figure can be viewed at wileyonlinelibrary.com]
