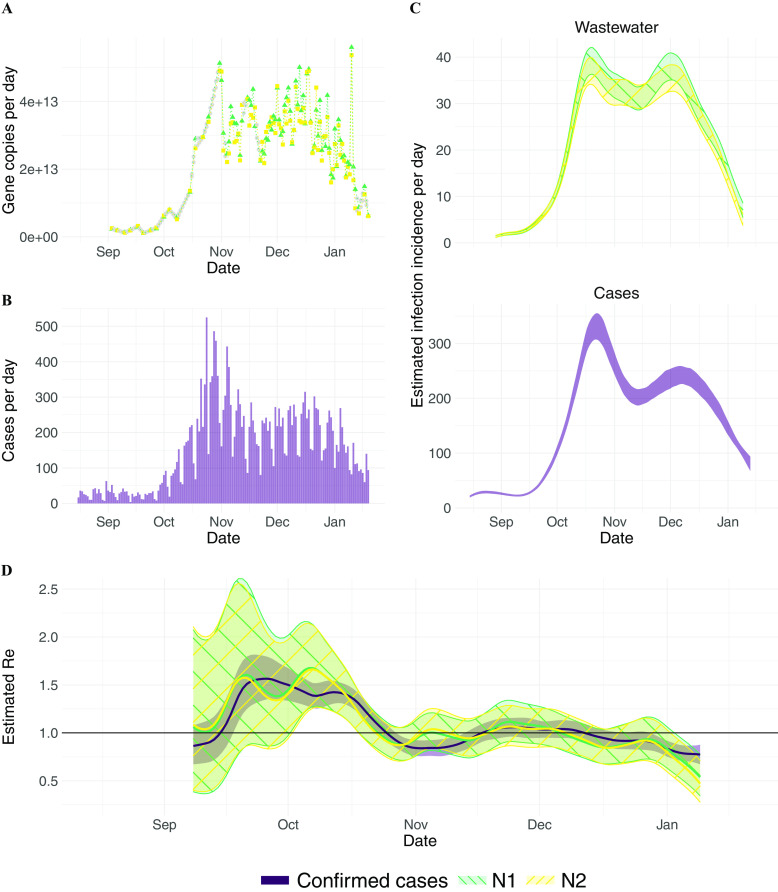
Figure 1.
estimation from Zurich (Switzerland) wastewater measurements. (A) Measured RNA loads of the N1 and N2 markers (green triangles and yellow circles, respectively) between 1 September 2020 and 19 January 2021 (99 samples, of which 2 were excluded based on quality control). Linearly interpolated values are indicated in gray. (B) Confirmed cases (purple) in the catchment during the same time period. (C) The estimated infection incidence in the catchment per day from normalized RNA loads of the N1 and N2 markers (top; green\-hatched and yellow/-hatched bands respectively), and case reports (bottom; purple solid band). The measured loads were normalized by the lowest measured value ( gene copies per infection). The ribbons indicate the deviation across 1,000 bootstrap replicates. (D) The estimated compared to the from confirmed cases. The colored line indicates the point estimate on the original data, and the ribbons the 95% CI across 1,000 bootstrap replicates. The N1- and N2-based CIs nearly completely overlap. The numeric data corresponding to this figure can be found in Excel Tables S2–S4. Note: CI, confidence interval; M, normalisation factor stemming from the virus recovery process; N, normalisation factor stemming from the total amount of virus shed per person; , estimated from case report data; , effective reproductive number; , estimated from viral RNA concentrations measured in wastewater.

