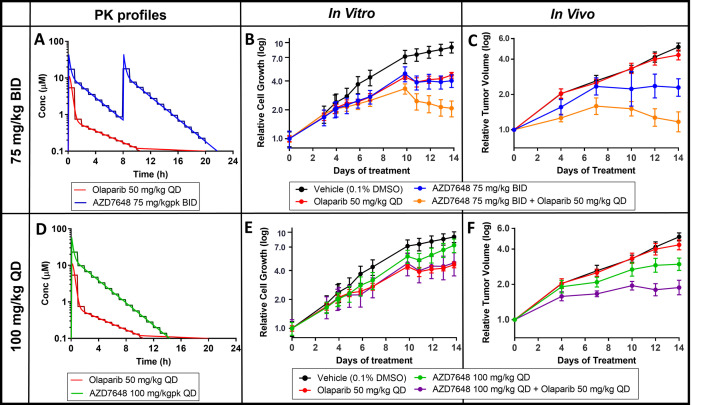
Fig 4. Olaparib and DNA-PK inhibitor AZD7648 in vivo PK profiles replicated using the Microformulator: comparing antiproliferative effect in vitro with in vivo results.
(A) In vivo PK profiles of olaparib (50 mg/kg QD) and AZD7648 (75 mg/kg BID) (continuous line, red and blue) matched with Microformulator-generated PK profiles (stepped line, red and blue). (B) IncuCyte analyisis of FADU ATM KO cell growth inhibition effects of olaparib and AZD7648 (75 mg/kg BID) monotherapy or combination delivered by the Microformulator each day for 14 days. (C) TGI of FaDu ATM KO xenografts treated with olaparib and AZD7648 (75 mg/kg BID) as monotherapy and in combination (SCID mice, n = 4–9 day 14). Data represent geomean ± SEM (tumour start volume 0.26 cm3). (D) In vivo PK profiles of olaparib (50 mg/kg QD) and AZD7648 (100 mg/kg QD) (continuous line, red and green) matched with Microformulator-generated PK profiles (stepped line, red and green). (E) IncuCyte analyisis of FADU ATM KO cell growth inhibition effects of olaparib and AZD7648 (100 mg/kg QD) monotherapy or combination delivered by the Microformulator each day for 14 days. (F) TGI of FaDu ATM KO xenografts treated with olaparib and AZD7648 (100 mg/kg QD) as monotherapy and in combination (SCID mice, n = 8–9 day 14). Data represent geomean ± SEM (tumour start volume 0.26 cm3). Underlying data can be found in S2 Data. DNA-PK, DNA-dependent protein kinase; KO, knockout; PK, pharmacokinetic; TGI, tumour growth inhibition.

