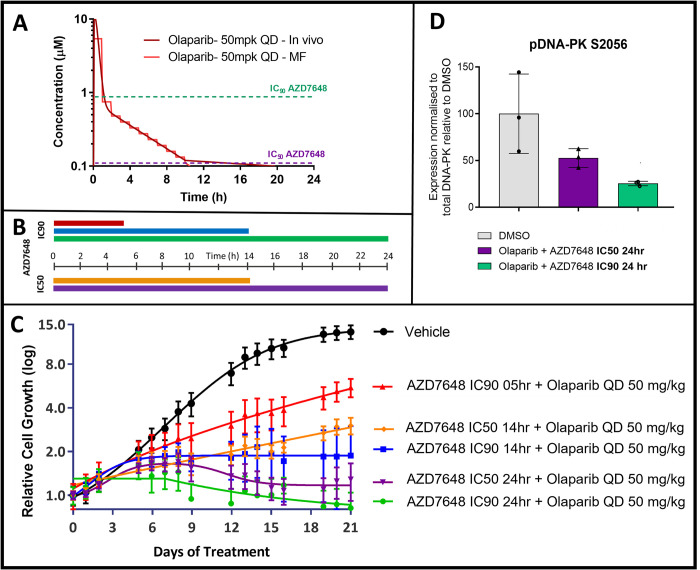
Fig 5. Investigating AZD7648 exposure parameters to maximise olaparib combination efficacy.
(A) In vivo and Microformulator-replicated PK profile of olaparib (50 mg/kg QD) and fixed IC90 and IC50 concentrations for DNA-PK AZD7648. (B) Durations of daily exposure to AZD7648 at either IC90 or IC50, (colours matched to C). (C) Growth inhibitory response, determined from Incucyte analysis, of FaDu ATM KO cells to olaparib and AZD7648 treatment delivered by the Microformulator at fixed IC90 and IC50 concentrations for indicated durations throughout each 24-hour cycle over 3 weeks. Data represent mean ± SEM of 3 technical replicates. (D) FaDu ATM KO cells were treated for 24 hours with olaparib plus AZD7648 at either IC50 or IC90 and whole cell lysates were collected. Proteins were separated by SDS-PAGE and detected by western blotting. The band intensity of pDNA-PK S2056 was quantified and expression was normalised to the quantity of the respective total protein. Graphs represent mean expression ± SD for pDNA-PK relative to its expression in the DMSO control. Individual data points represent technical replicates. Underlying data can be found in S3 Data. DNA-PK, DNA-dependent protein kinase; KO, knockout; PK, pharmacokinetic.

