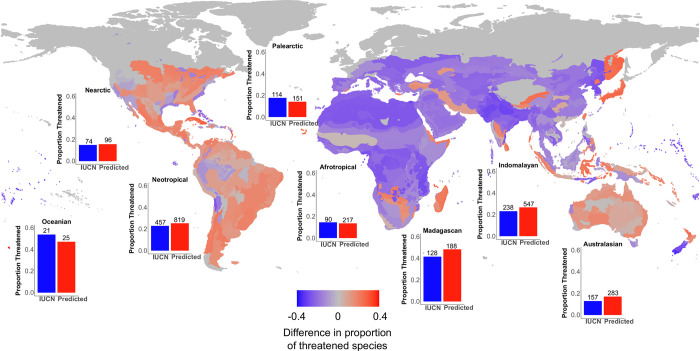
Fig 3. Global spatial changes in the percentage of threatened reptile species resulting from our automated assessments.
The spatial data are grouped by WWF terrestrial ecoregions. The shift between red and blue is proportional to the (symmetric log scale) increase/decrease in extinction risk per ecoregion when using our assessments. Bar plots indicate proportion of species in threatened categories for each biogeographical realm, before and after the inclusion of automated assessments. The data underlying this figure can be found in S2 Data. IUCN, International Union for Conservation of Nature; WWF, World Wide Fund for Nature.

