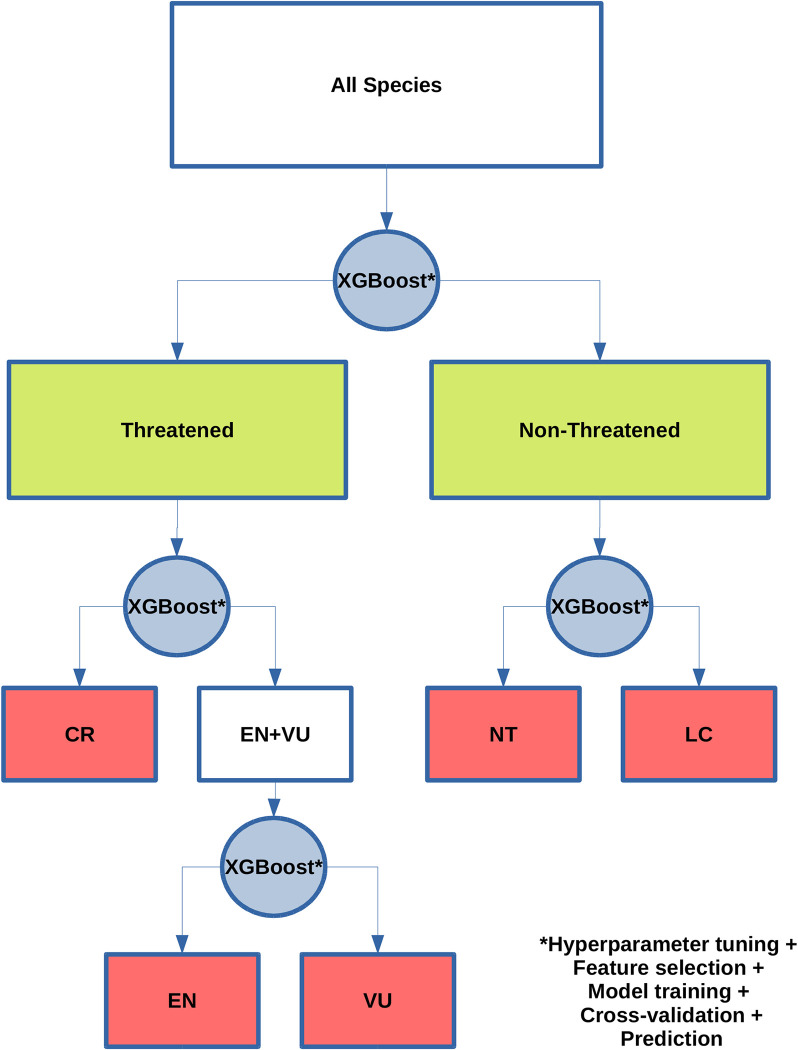
Fig 5. Flowchart for classification tasks in automated extinction risk assessment method, using the XGBoost algorithm [29].
Green boxes represent outcomes of the binary task and red boxes represent the outcome of the specific tasks. Steps taken for each classification task (blue circle) are indicated after the asterisk. CR, Critically Endangered; EN, Endangered; LC, Least Concern; NT, Near Threatened; VU, Vulnerable.

