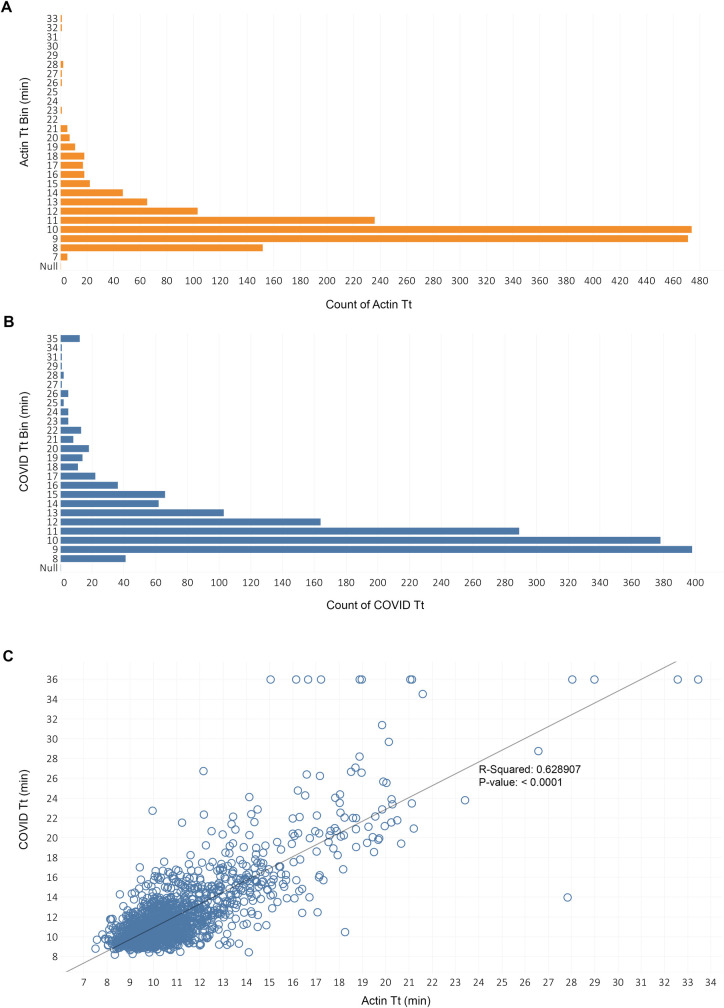
Fig 3. Performance of the extraction-free RT-LAMP method using saliva collected from a large cohort of individuals.
A total of 1670 negative saliva samples were each spiked with 50 copies/μL of virus and evaluated in COVID and actin LAMP reactions. Histogram depicting the distribution of Tt values from COVID (A) and actin (B) LAMP reactions are shown. (C) Plotted COVID and actin Tt values (blue circles) and linear regression line with the value of R squared (Pearson product-moment correlation coefficient) and p-value. No amplification is assigned a Tt value of 36 for plotting purposes.

