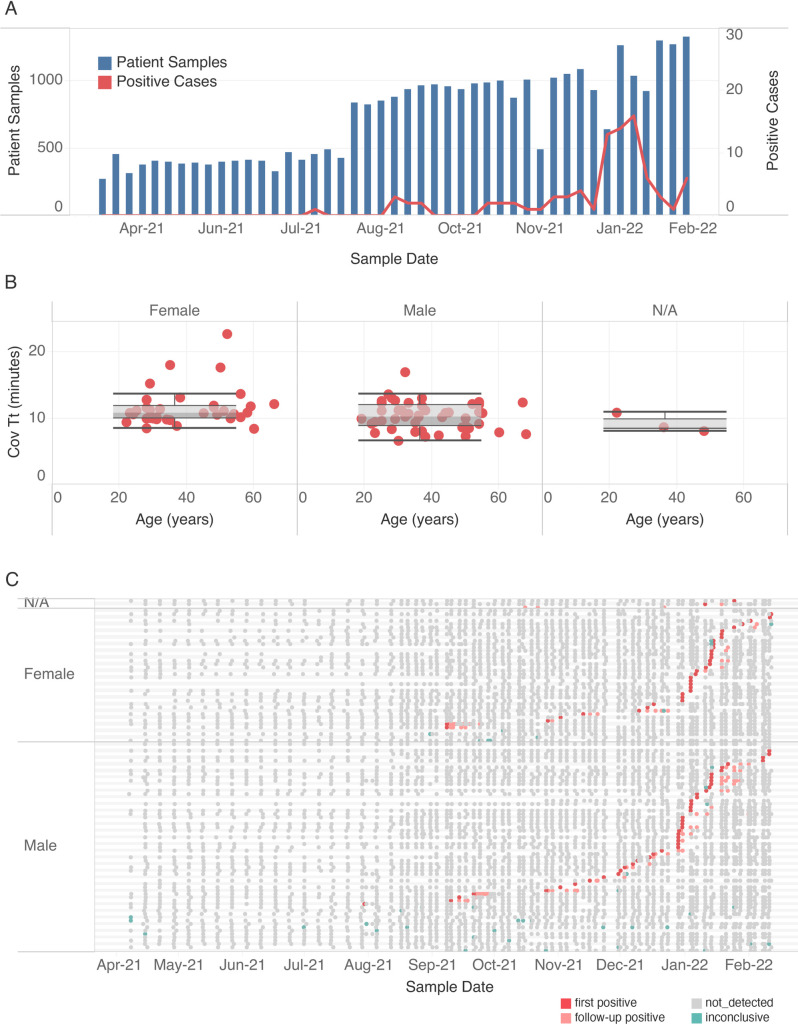
Fig 6. Using extraction-free saliva RT-LAMP for workplace surveillance.
(A) The number of samples tested each week from 4/9/2021 until 2/9/2022 (blue bars) and new positive cases identified (red line). (B) Distribution of initial COVID Tt values obtained from male, female and individuals with gender not indicated (N/A). Average Tt values for first positive cases (Y-axis) based on gender (columns) and submitter age (X-axis), median (line), quartile boundaries (boxes), and 1.5x the interquartile range (whiskers) are displayed. (C) Testing history of all positive cases from April 2021 to February 2022. For each employee, negative (grey), positive (dark red, first detected; light red, subsequent detection), or inconclusive (green) results are indicated.

