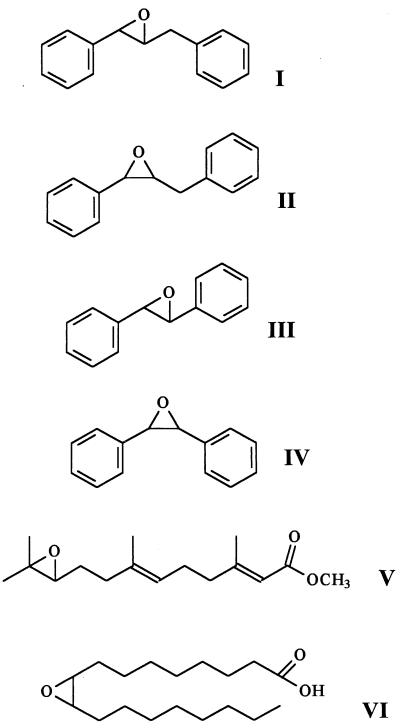
TABLE 3.
Substrate selectivity of EH activities of A. alternata f. sp. lycopersici extracts
| Substrate | Relative activitya (mean ± SD) (n = 3)
|
|||||
|---|---|---|---|---|---|---|
| Pectin medium
|
Glucose medium (day 6)
|
|||||
| Day 6
|
Day 12
|
|||||
| Control | With clofibrate | Control | With clofibrate | pH 4 | pH 6 | |
 |
100 ± 4 | 100 ± 4 | 100 ± 14 | 100 ± 14 | 100 ± 7 | 100 ± 11 |
| 23 ± 2 | 23 ± 2 | 16 ± 1 | 34 ± 4 | 49 ± 5 | 48 ± 5 | |
| 7.3 ± 0.4 | 7.1 ± 0.4 | 8.4 ± 0.9 | 4.4 ± 0.4 | 9.2 ± 0.2 | 5.3 ± 0.5 | |
| 0.5 ± 0.1 | 0.6 ± 0.1 | 11 ± 1 | 1.4 ± 0.1 | 1.1 ± 0.1 | 0.9 ± 0.1 | |
| 257 ± 18 | 231 ± 25 | 371 ± 37 | 128 ± 5 | 123 ± 1 | 145 ± 21 | |
| 139 ± 18 | 128 ± 7 | 200 ± 24 | 61 ± 14 | 73 ± 10 | 76 ± 11 | |
Relative to activity with t-DPPO, taken as 100%. Specific activities for t-DPPO, in nanomoles per minute per milligram, are as follows: 1.13 for pectin control medium on day 6, 1.21 for pectin medium with clofibrate on day 6, 0.7 for pectin control medium on day 12, 1.4 for pectin medium with clofibrate on day 12, 8.3 for glucose medium at pH 4.0, and 1.9 for glucose medium at pH 6.0.
