
Fig. 3.
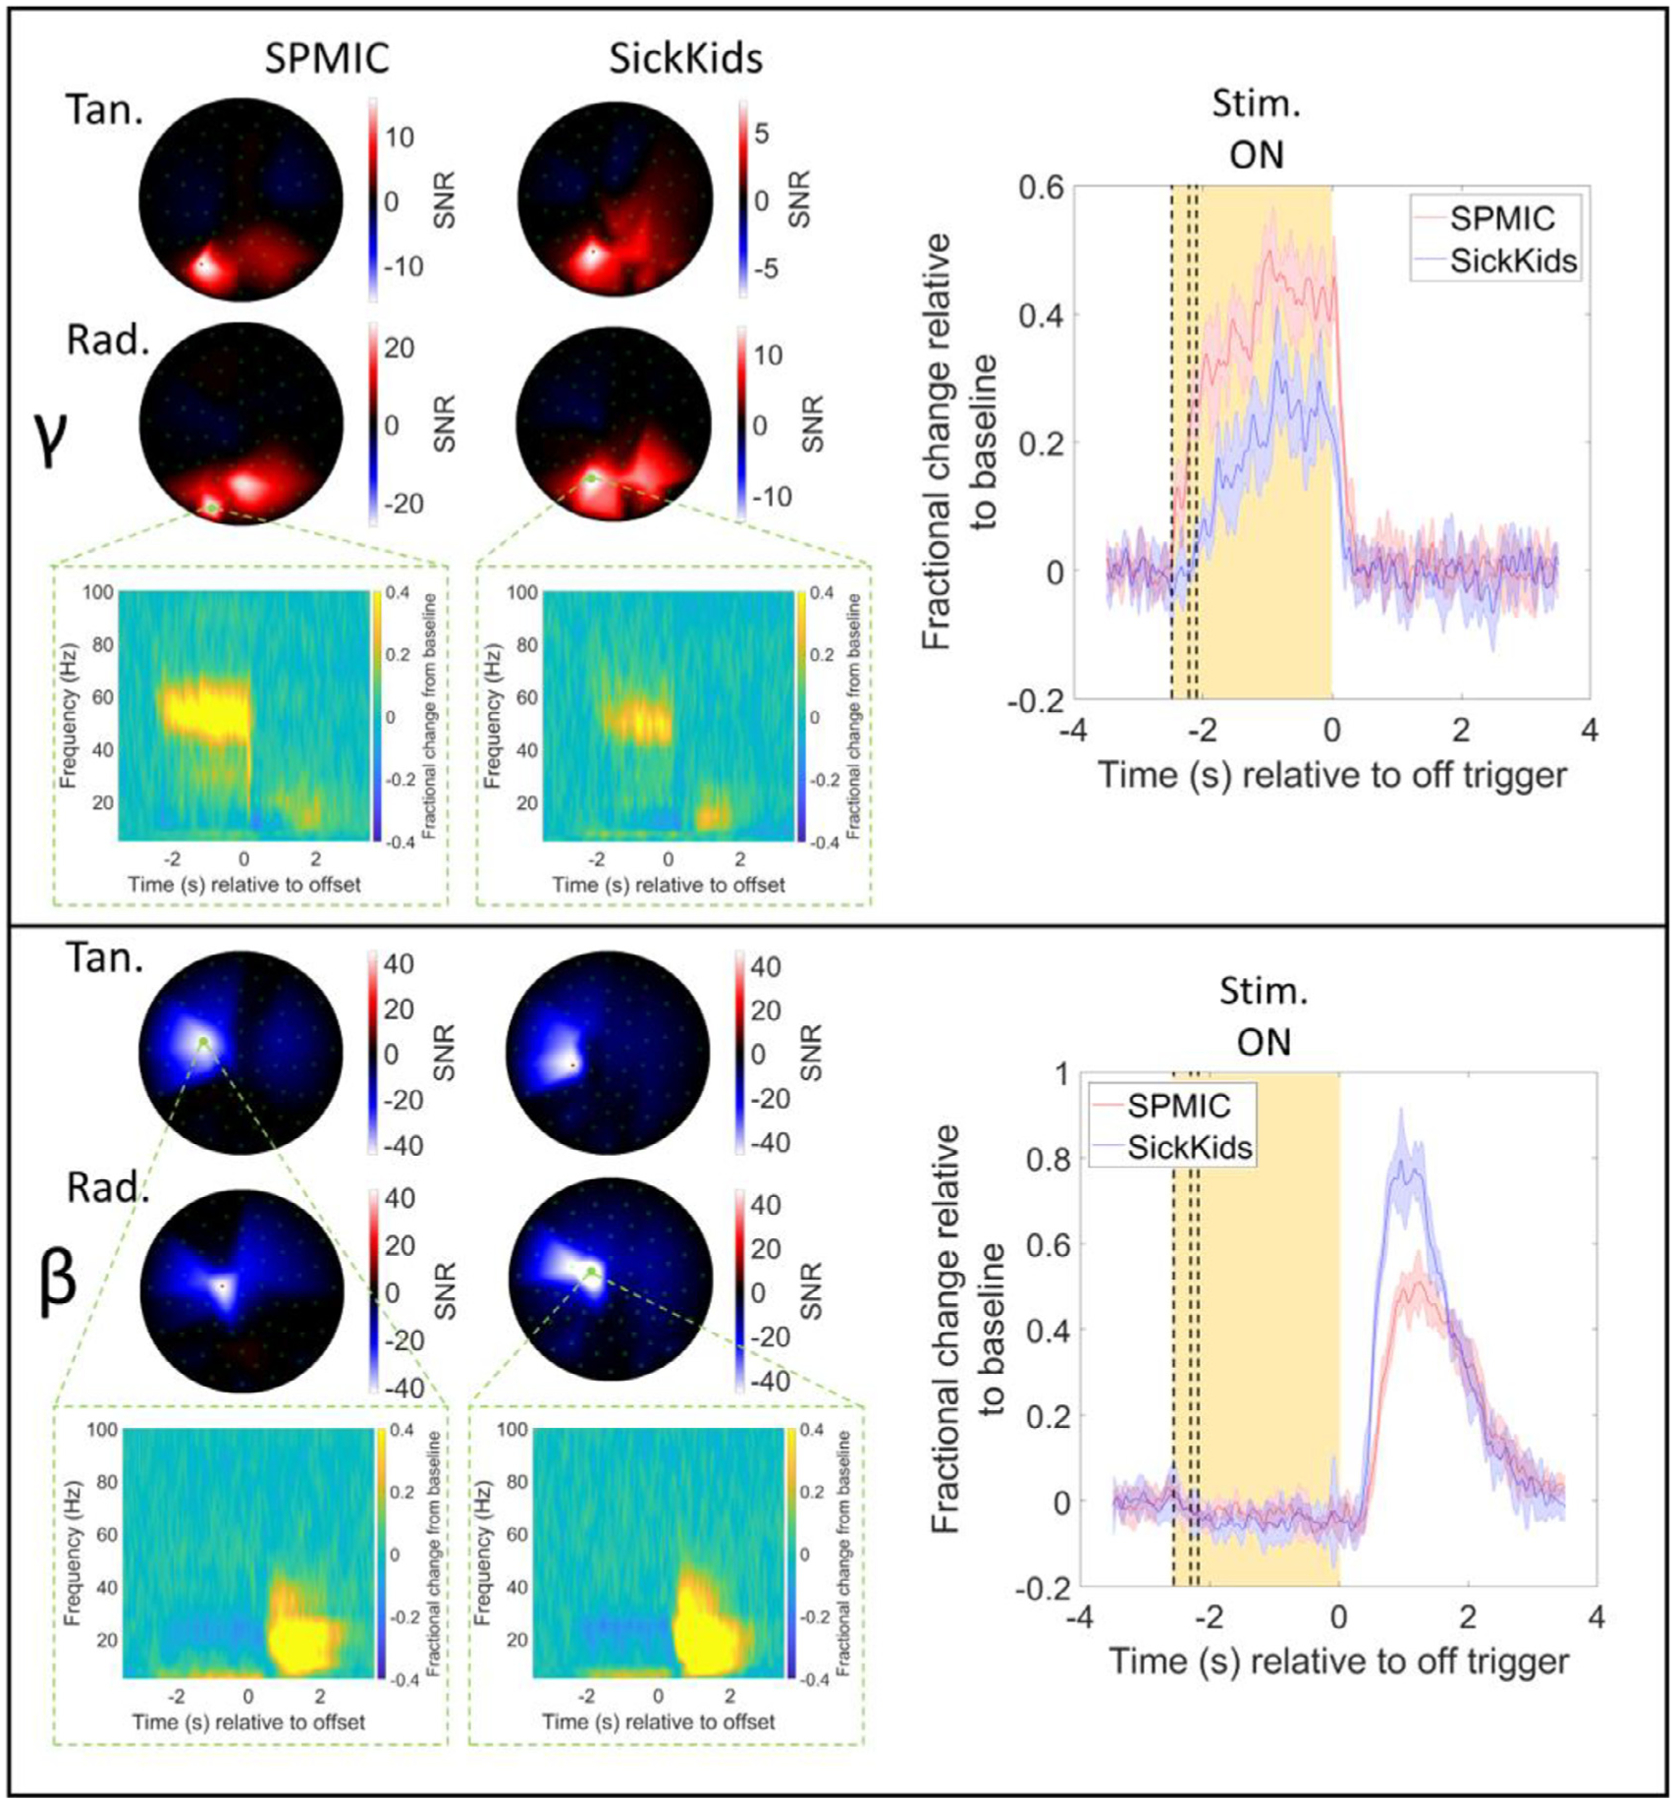
Visuo-motor results (sensor-level). Upper panel: Sensor-level results for the gamma-band (35 – 60 Hz). Spatial topography of the signal-to-noise ratios (SNR) for each sensor averaged across all 5 runs is shown for each site (tangential-axis measurements on top, radial-axis on bottom). On the right, the trial-averaged envelope for the sensor with the highest SNR in the beta band is plotted, with shaded error bars showing the standard deviation across all 5 runs. The yellow shaded region shows the active window, with dashed lines showing the jittered durations of 2.1, 2.2, and 2.4 s. Results for each site are overlaid, SPMIC in red and SickKids in blue. Time-frequency spectrograms are also shown for the sensor with the highest SNR. Lower panel: Same as the upper panel but in the beta-band (13 – 30 Hz).