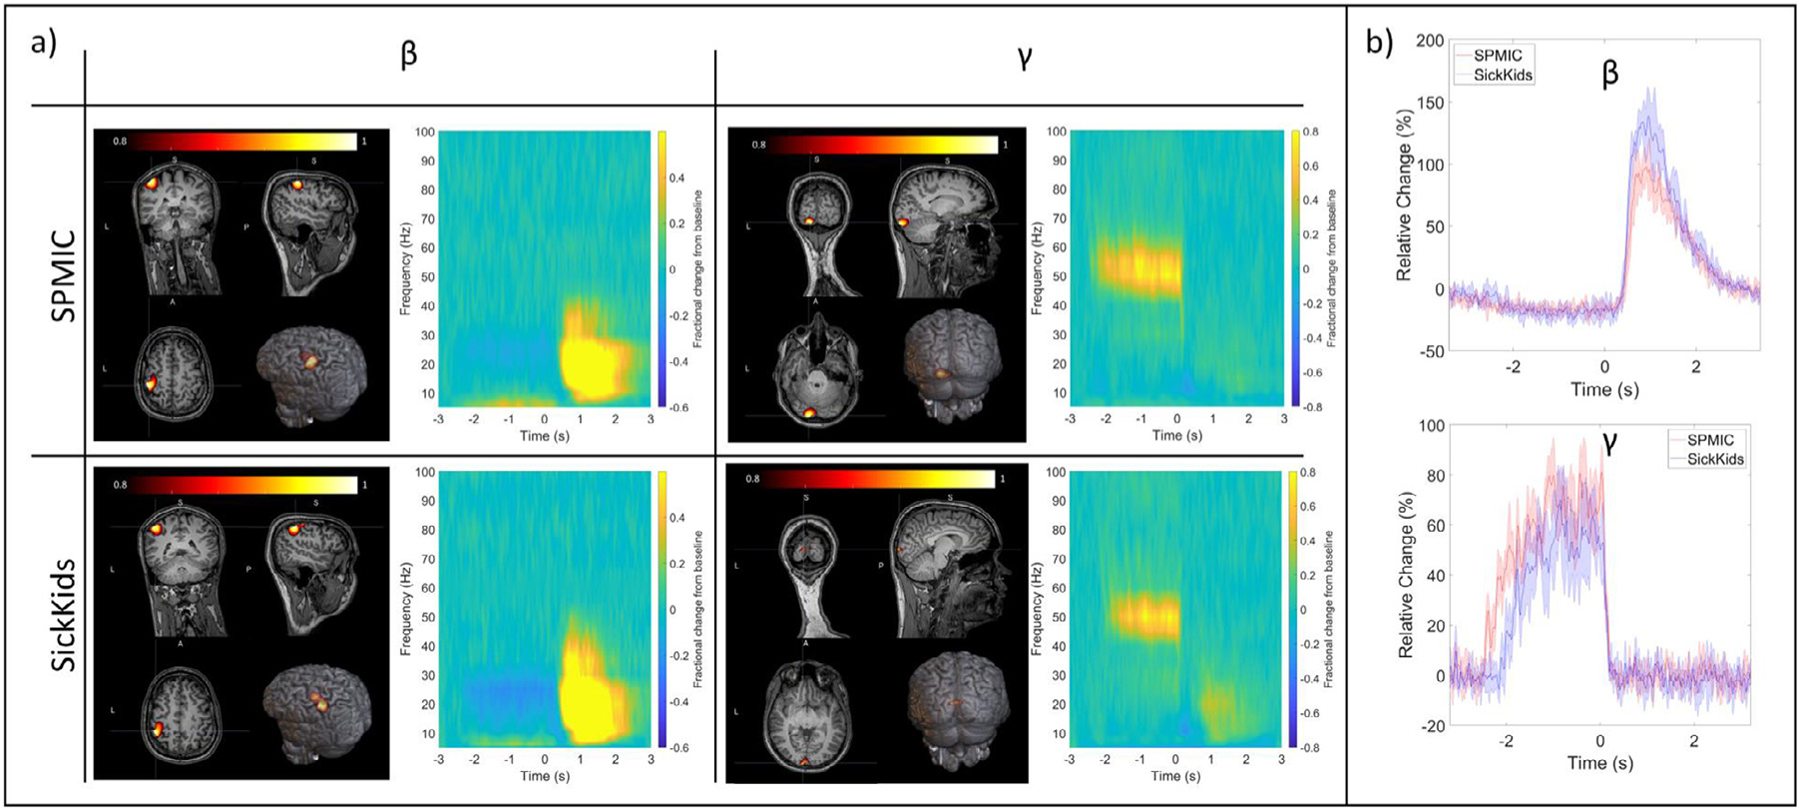
Fig. 4.

Visuo-motor results (source-level). a) The left and right columns show beta- and gamma-band results respectively. The upper and lower rows show data from the SPMIC and SickKids sites. In each case, a pseudo-t-statistical image, showing the spatial signature of oscillatory modulation (averaged over all 5 runs) is shown on the left, and a time-frequency spectrum for the locations of peak modulation on the right. b) The trial averaged oscillatory envelopes for the beta- (top) and gamma-band (bottom) with SPMIC shown in red, and SickKids in blue with shaded error bars showing the standard deviation across all 5 runs.
