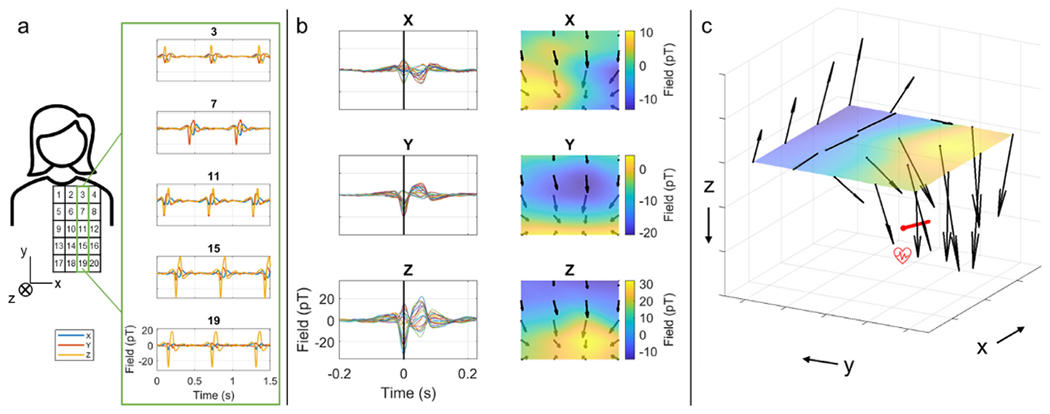
Fig. 4. The vector field induced by the heart.

a) Schematic showing the experimental set-up. 4 OPMs were placed at 20 locations above the chest (approximately over the heart). The OPMs were moved sequentially (from top to bottom) to measure the magnetic fields from the heart. Inset shows heart signal (filtered [5–45] Hz) from a single sensor at 5 different locations (x in blue, y in orange, z in yellow). b) Left panels show an average over cardiac cycles of the PQRST waves for x (top), y (middle) and z (bottom) magnetic field components for the 20 sensor locations. Right panels show the corresponding 2D field maps at time zero, corresponding to the time of the R-peak. c) A reconstruction of the vector magnetic fields from the heart at time zero. Note that the orientation of the fields suggests current flow along the x-direction in the chest as expected (represented by the red arrow).
