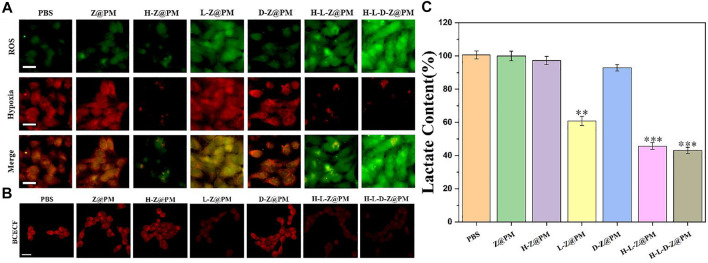
FIGURE 4.
H-L-D-Z@PM-mediated generation of oxidative stress and slightly acidic and hypoxic environment in 4T1 cells. Fluorescence micrographs of 4T1 cells with (A) oxidative stress/hypoxia (Scale bar: 20 µm) and CLSM images of 4T1 cells. (B) pH (scale bar: 20 µm) detection probes in different treatments. (C) Lactate content after incubation with different materials for 24 h **p < 0.01, ***p < 0.001.

