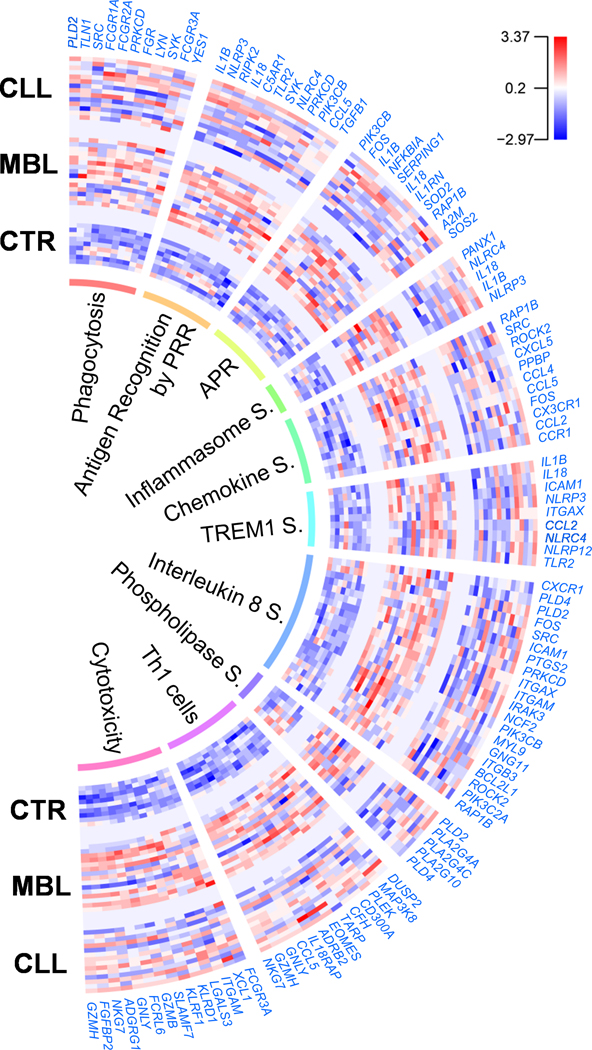
Figure 2.

Differentially expressed genes and pathways in total CD4+ cells of MBL and CLL patients. Gene expression intensity is represented as log2 values centered and scaled. Detailed information of the enumerated genes is provided in Supplementary Table 3. CTR: Healthy controls; PRR: Pattern recognition receptors; APR: Acute phase response; S.: Signaling.
