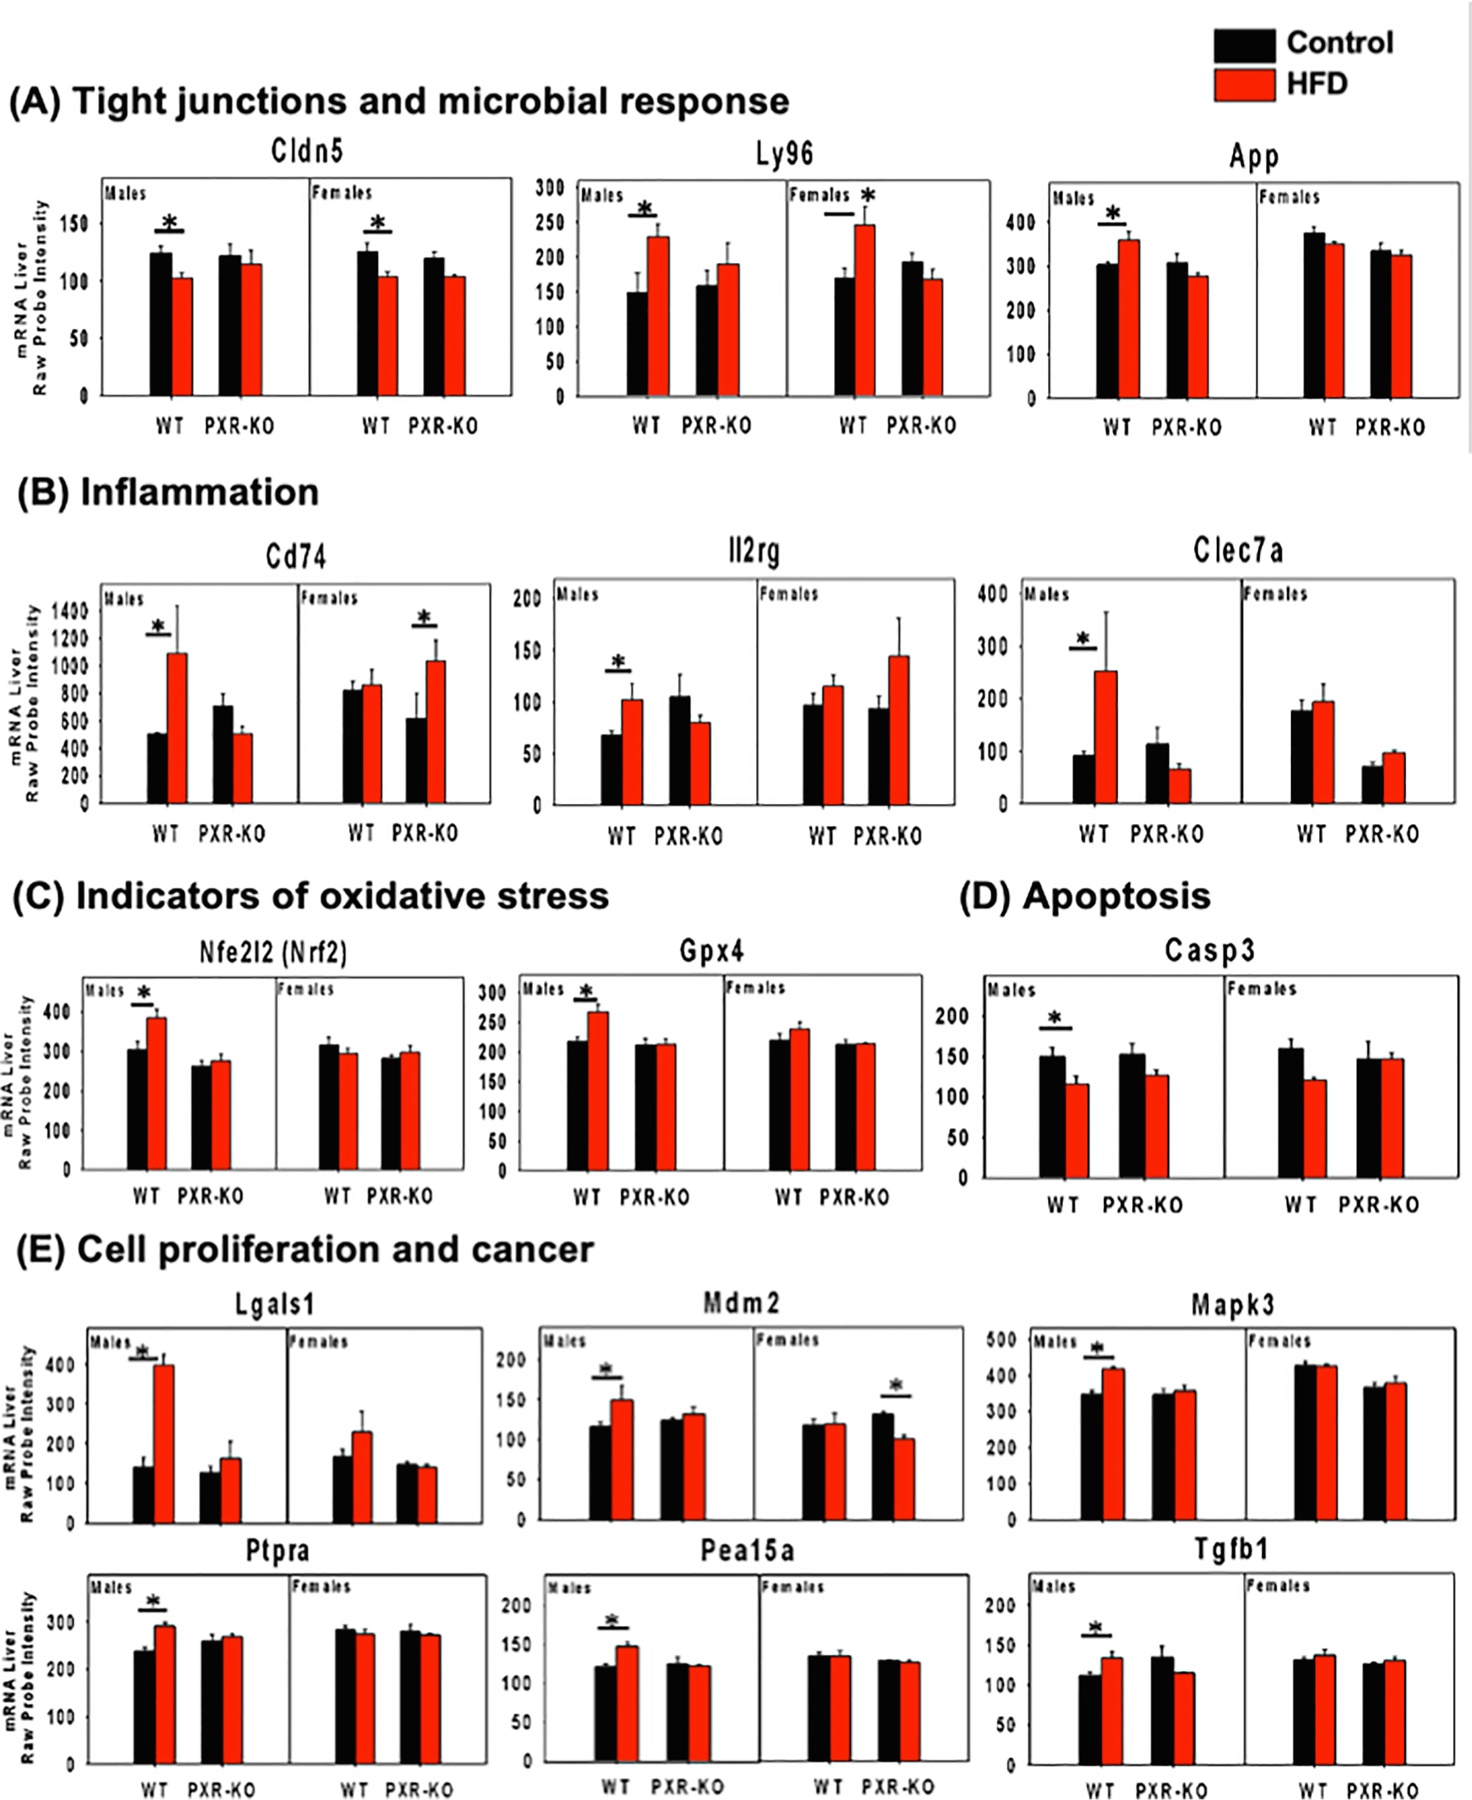
Fig. 10.

mRNA expression of differentially regulated genes involved in tight junctions and microbial response from the liver microarray experiments. (A). tight junctions, (B). inflammation, (C). indicators of oxidative stress, (D). apoptosis, (E). cell proliferation and cancer are shown. Asterisks represent statistically significant differences between HFD and the control group of the same sex and genotype (limma, adjusted p-value < 0.05).
