Fig. 2.

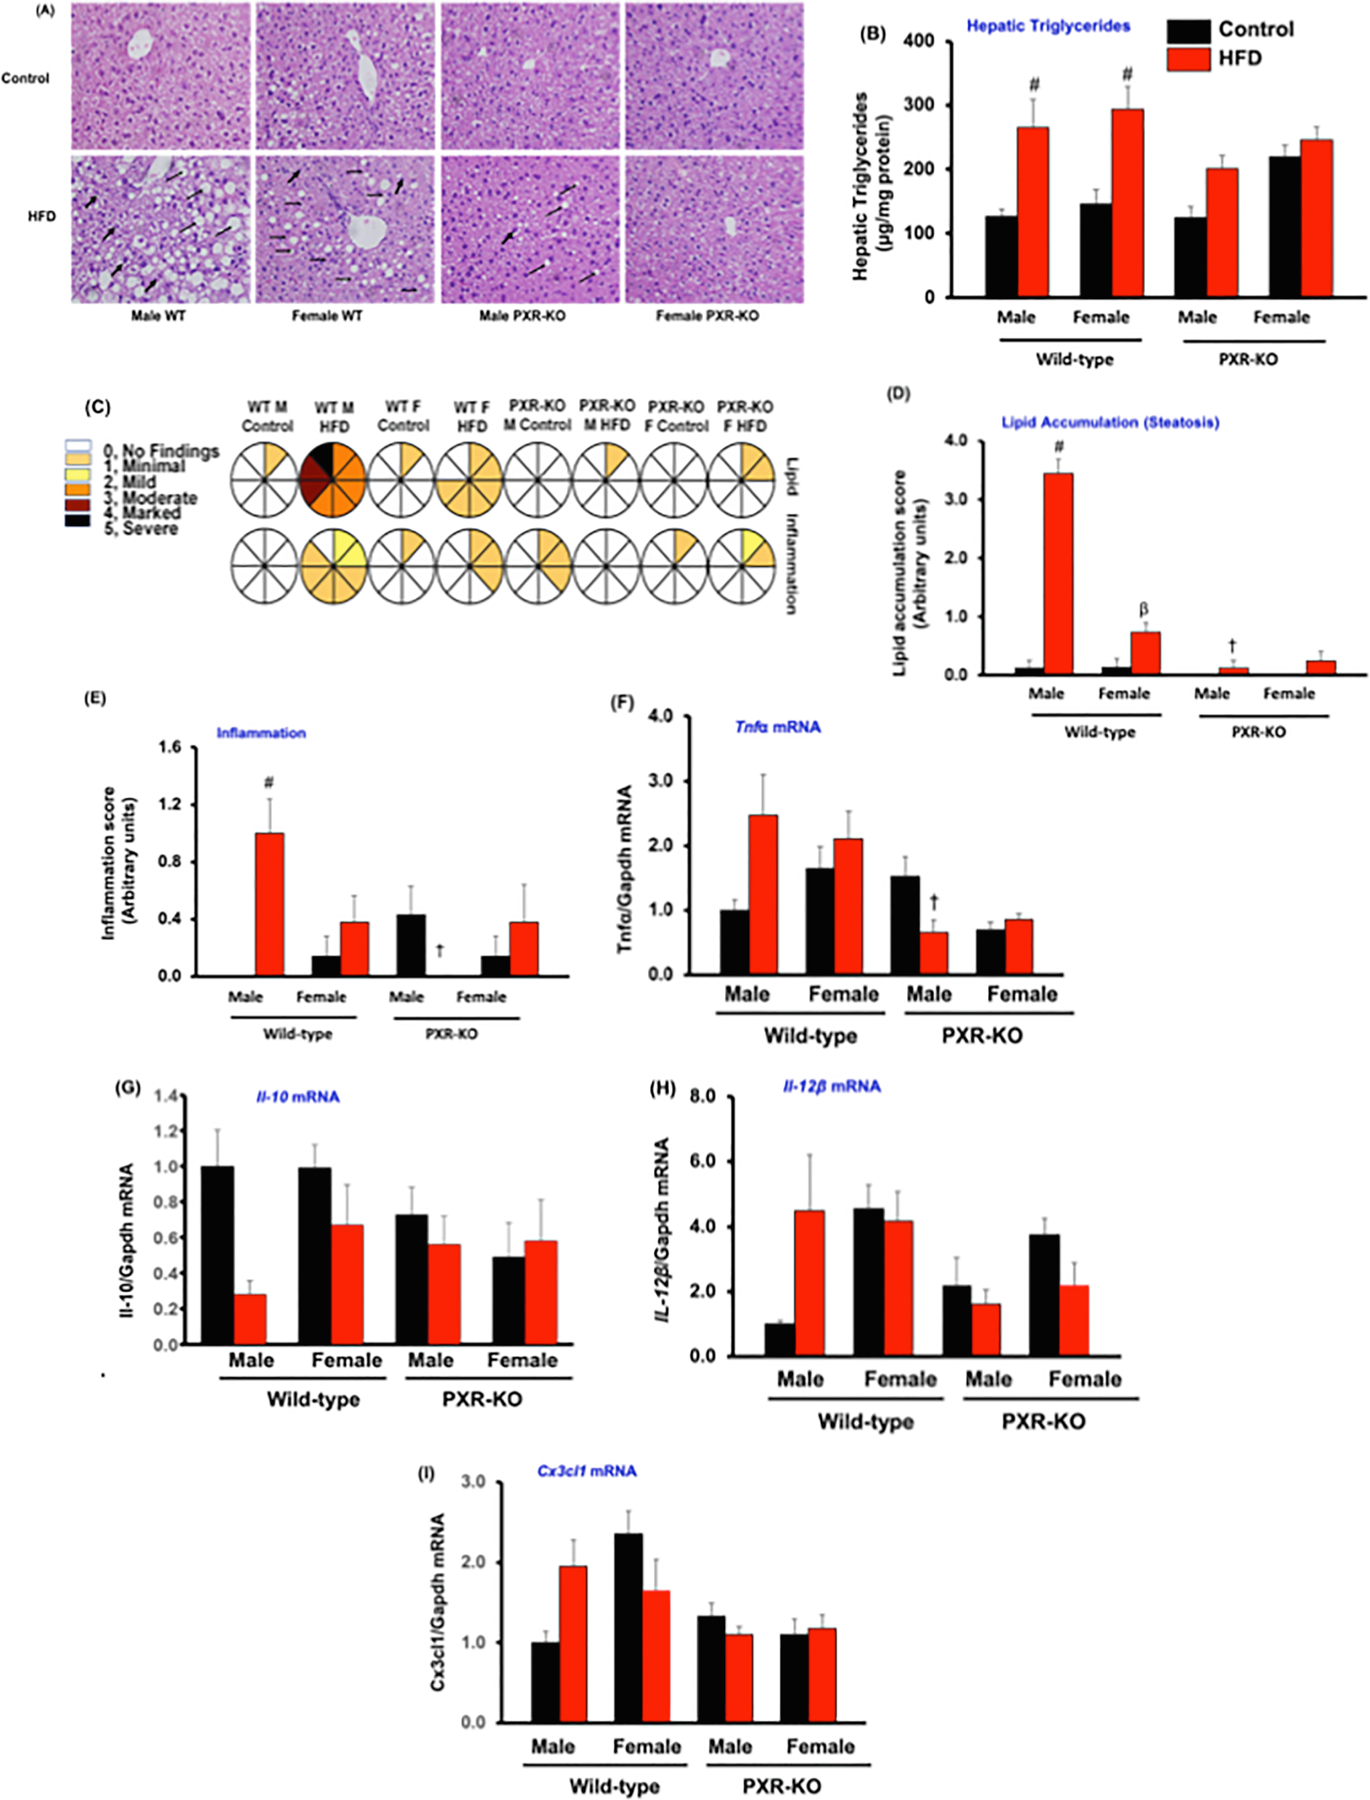
Characterization of hepatic histology, hepatic lipid levels and hepatic inflammatory cytokines gene expression in male and female WT and PXR-KO mice. (A). Hematoxylin and eosin (H&E) staining of liver sections. (B). Hepatic triglyceride levels (C). Lipid accumulation and inflammation pathology scores from histology of liver sections in control diet and HFD-fed WT and PXR-KO mice. A scale of 0 (no injury) to 5 (most severe injury) was used to assign the pathology scores in a double-blinded manner by a licensed pathologist. (D). Lipid accumulation (steatosis) and (E). Inflammation from histology of liver sections in control diet and HFD-fed WT and PXR-KO mice. Data represent mean ± SEM (n = 7–11). Hepatic gene expression of (F). Tnfα (G). Il-10 (H). Il-12β (I). Cx3cl1. Data represent mean ± SEM (n = 4–6). #P < 0.05 between mice fed control and high-fat diet (HFD). †P < 0.05 between male mice fed HFD. βP < 0.05 between male and female mice fed HFD.
