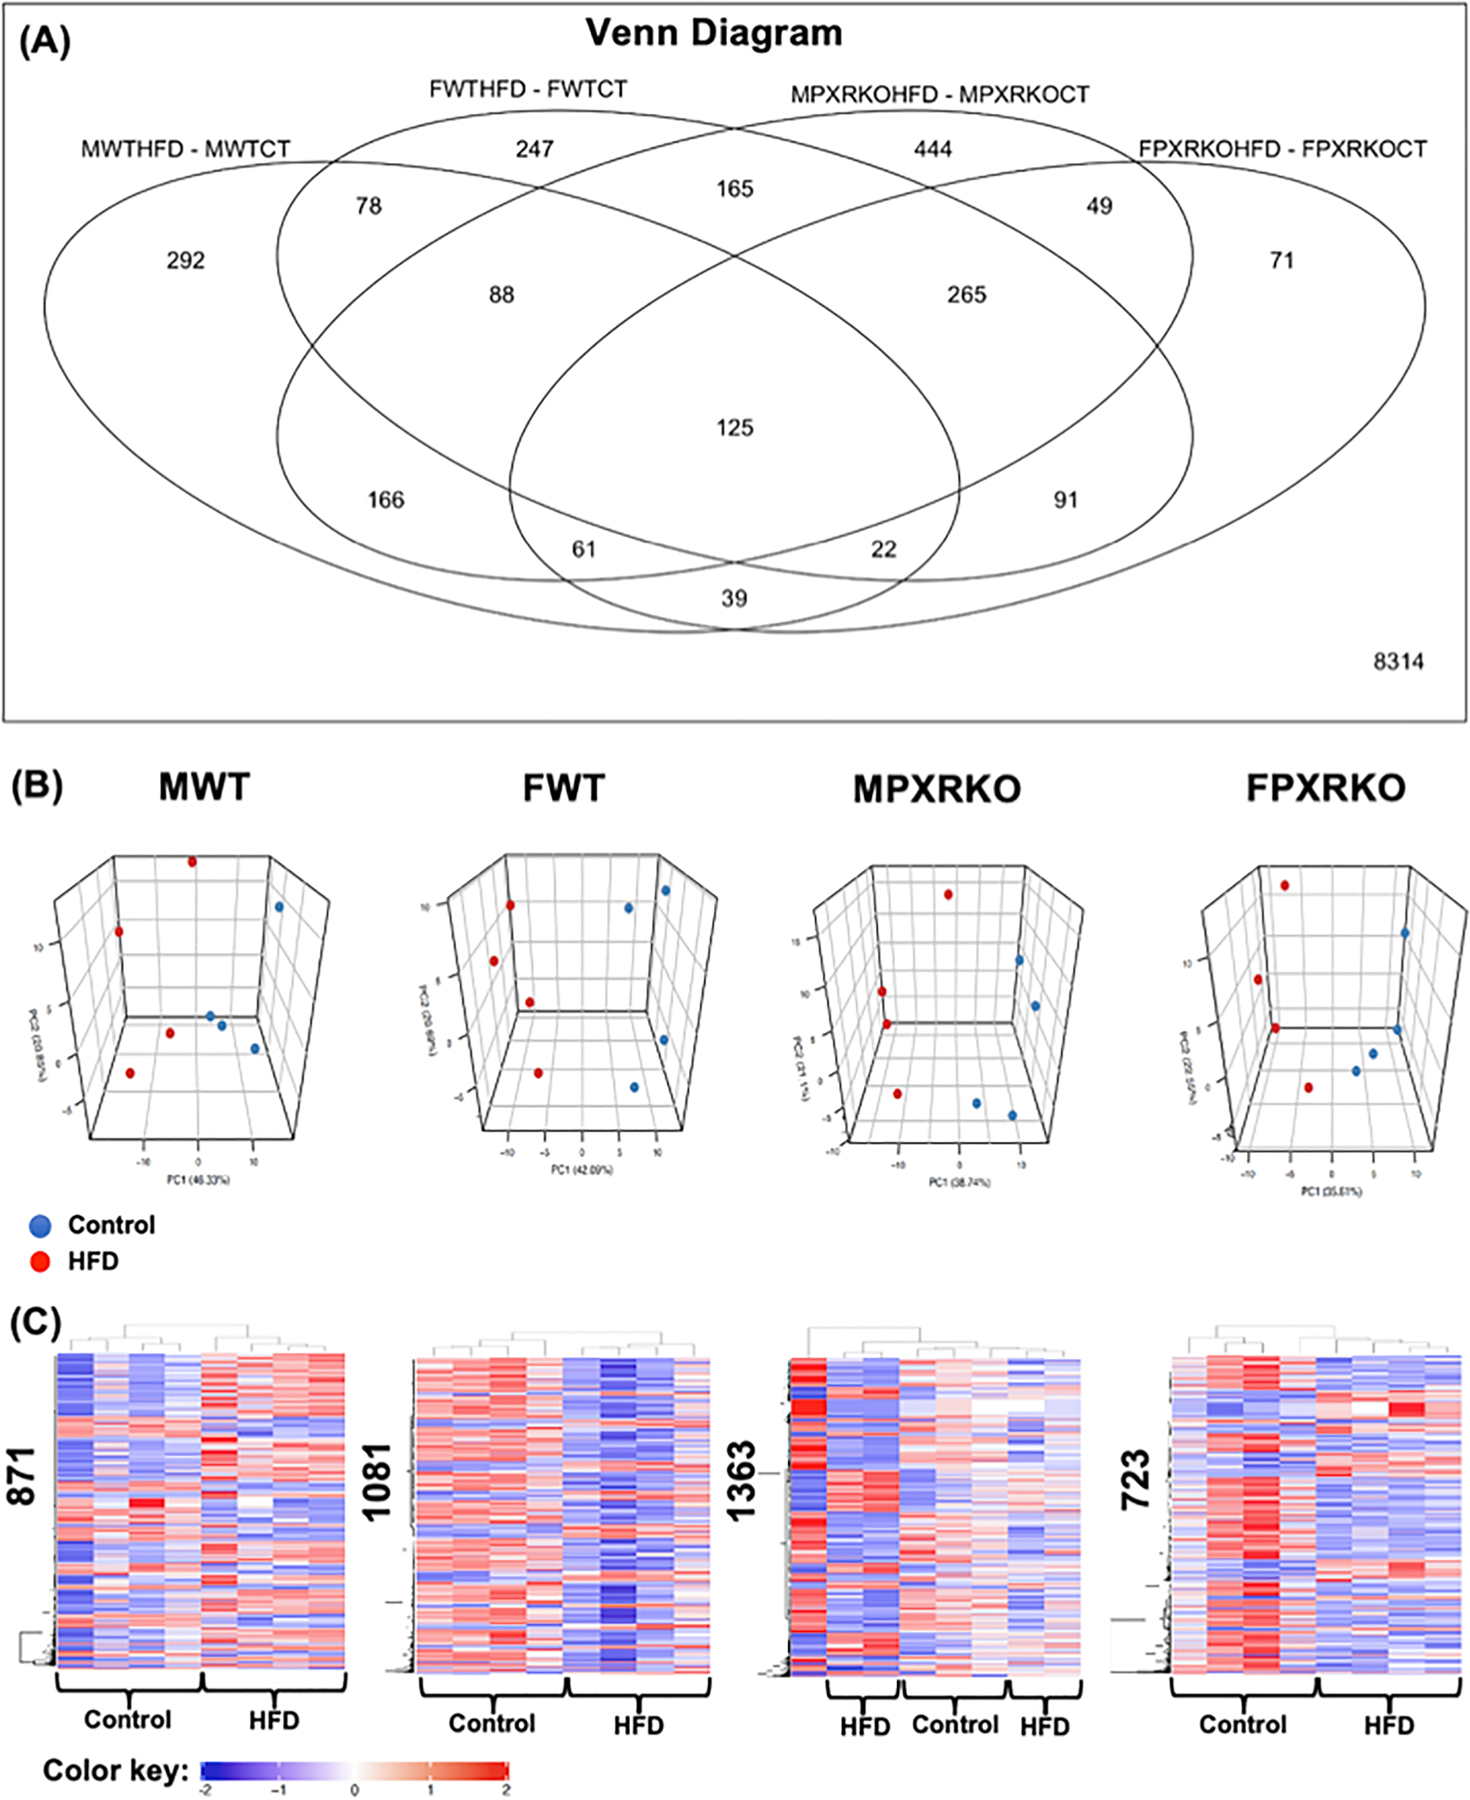
Fig. 4.

The effect of HFD on hepatic transcriptome in male and female WT and PXR-KO mice from the liver microarray experiments. (A). A Venn Diagram showing the common and uniquely regulated genes by HFD in each paired comparison (MWTHFD-MWTCT: effect of HFD over control in livers of male WT mice; FWTHFD-FWTCT: effect of HFD over control in livers of female WT mice; MPXRKOHFD-MPXRKOCT: effect of HFD over control in livers of male PXR-KO mice; FPXRKOHFD-FPXRKOCT: effect of HFD over control in livers of female PXR-KO mice). Data were analyzed using the limma R package and controlled for errors of multiple testing (adjusted p-value < 0.05). (B). Principal component analysis (PCA) in control and HFD-exposed groups in each sex and genotype using the prcomp function. (C). Two-way hierarchical clustering dendrograms of differentially regulated genes by HFD in MWT, FWT, MPXR-KO, and FPXR-KO conditions, as generated by the heatmap.2 function in the gplots R package. The numbers on the y-axis indicate the total number of differentially regulated genes by HFD (adjusted p-value < 0.05). Red represents relatively high expression, blue represents relatively low expression. (For interpretation of the references to colour in this figure legend, the reader is referred to the web version of this article.)
