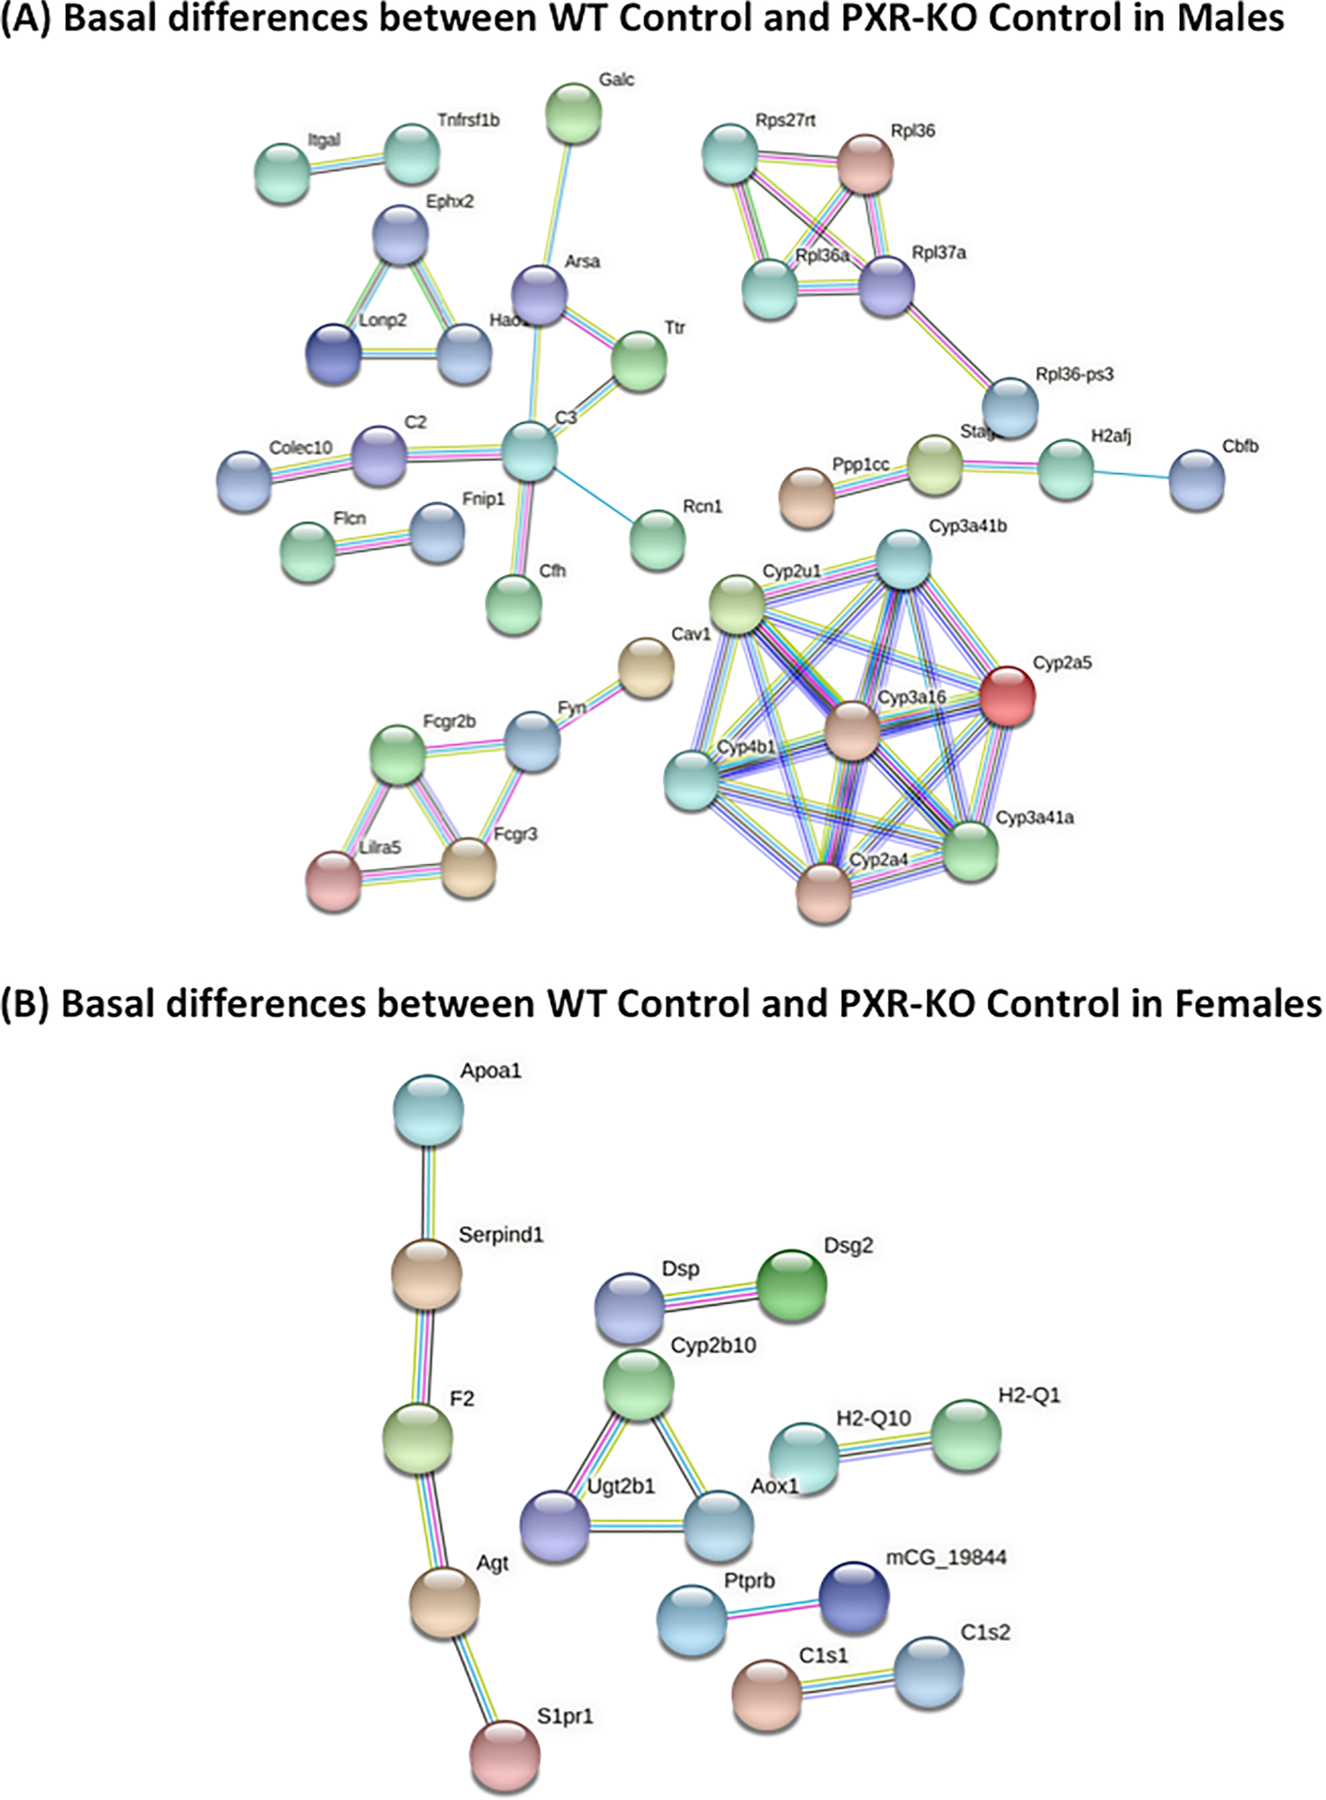
Fig. 9.

String analysis showing the uniquely regulated pathways by control diet in livers of male and female WT and PXR-KO mice from the liver microarray experiments. (A). Basal gene expression differentially regulated by control diet in male WT and PXR-KO mice. (B). Basal gene expression differentially regulated by control diet in female WT and PXR-KO mice. The full network with the edges based on highest confidence indicating both functional and physical protein associations was examined. Disconnected nodes in the network are not shown.
