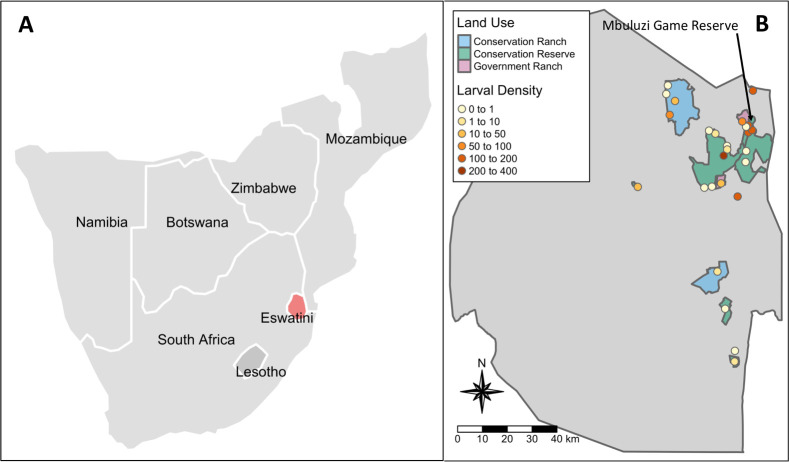
Fig 1. Study area.
(A) Map of southern Africa with Eswatini indicated in red and (B) map of Eswatini indicating land use and the density of Amblyomma larvae per 100m2 at sampling sites during the dry season of 2018. Sampling sites not located within a conservation reserve, cattle ranch, or conservation ranch were in community lands. Made with Natural Earth (https://www.naturalearthdata.com.

