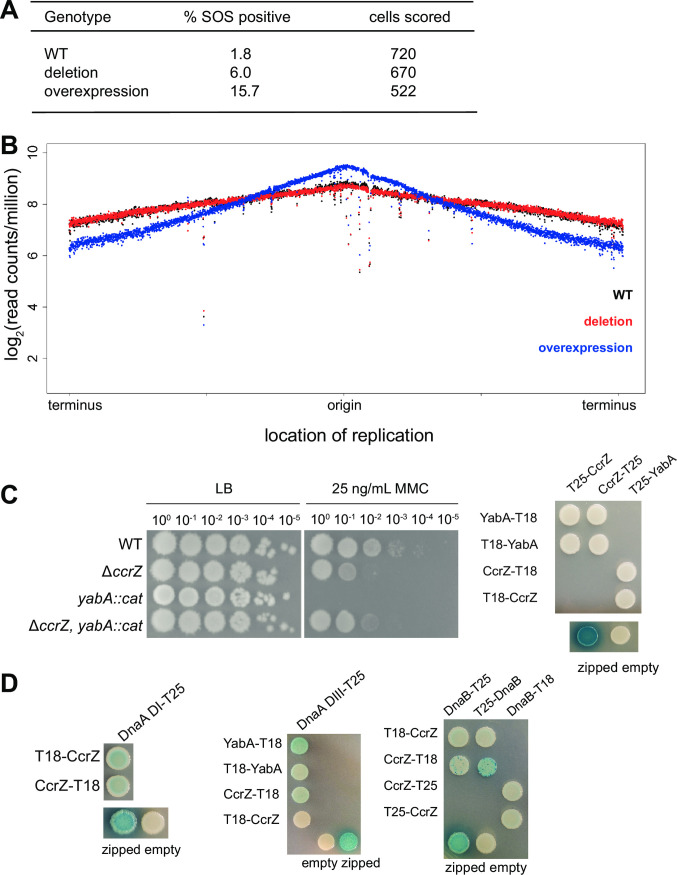
Fig 2. Assessment of ccrZ in DNA replication initiation.
(A) Quantification of % single cells with TagC-GFP as a measure of % SOS induction. p-value (WT vs. deletion) = 9.39x10⁻³, p-value (WT vs. overexpression) = 2.40x10⁻⁴. (B) Averaged whole genome resequencing from three biological replicates of WT (black), ΔccrZ (red), and ccrZ overexpression (blue) cells. Log2-fold abundance was plotted against chromosome location. (C) Spot titer assay to determine genetic relationship between ccrZ and yabA on MMC (left). Bacterial two-hybrid assay testing for interaction between YabA and CcrZ (right). Three biological replicates were performed before producing the representative image. (D) Bacterial two-hybrids showing interaction between CcrZ and DnaA domain I, domain III, and DnaB. Three biological replicates were performed before producing the representative image.

