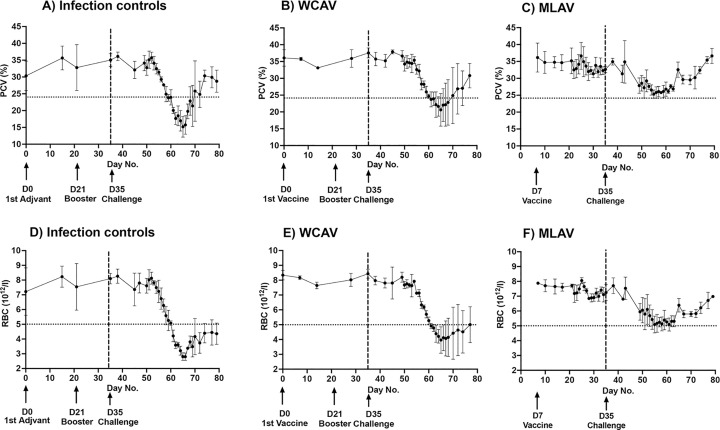
Fig 3. PCV and RBC count assessed in all three groups of steers.
Average PCV and RBC values from animals sampled during the study period were presented for the non-vaccinated animals, WCAV and MLAV during vaccination phase and following infection challenge. Days of adjuvant injections (control group), vaccinations (WCAV and MLAV) and infection challenge day (all three groups) are identified in the figures. At significance level α = 0.05, One-way ANOVA with repeated measures showed significant differences for PCV (P = 0.0128*) and RBC (P = 0.0375*) levels for MLAV compared to infection controls or WCAV group animals for the days 60–70. However, no significant difference was observed for WCAV and infection control groups throughout the study period. Tukey’s multiple comparisons test also showed similar significant differences in PCV (P = 0.0056**) and RBC P = 0.0294*) for MLAV group animals compared to infection controls or WCAV animals between days 60 and 70. This method also did not yield significant difference between infection controls and WCAV animals.

