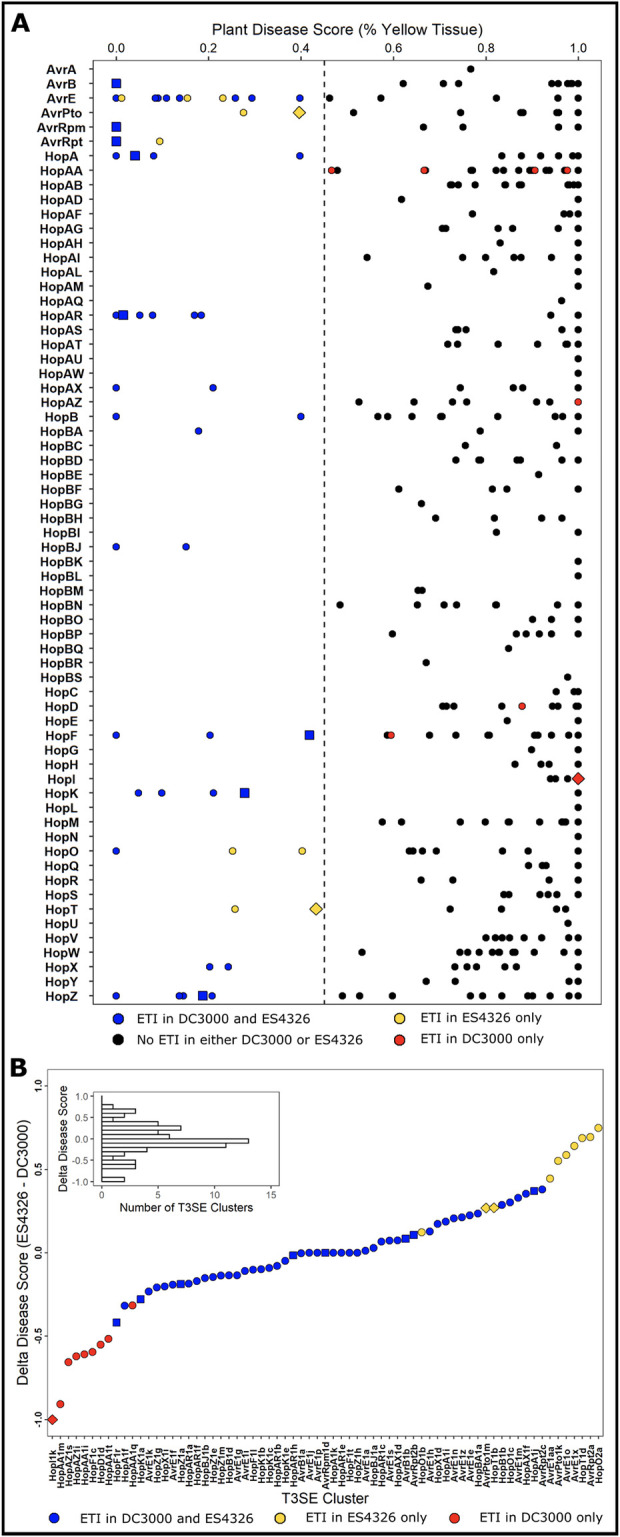
Fig 1. ETI potential of P. syringae T3SEs delivered from PmaES4326.

(A) Plant disease scores of PmaES4326 strains carrying each of the 529 PsyTEC T3SE alleles from 65 families after spray infection of 4–6 A. thaliana accession Col-0 individuals. Plant disease scores were determined by assessing the percent of yellow tissue [43] within the bounds of the positive ETI control (HopZ1a, disease score = 0.0) and the negative ETI control (EV, disease score = 1.0). A disease score below 0.45 was used as the threshold to classify ETI responses. Color coding provides a comparison of the current PmaES4326 data to published PtoDC3000 data [9]: black—no ETI when delivered from either genetic background; blue—ETI when delivered from either PtoDC3000 or PmaES4326; red—ETI observed only when delivered from PtoDC3000; and yellow—ETI observed only when delivered from PmaES4326. The eight well-characterized ETI-eliciting T3SE alleles used to determine the disease score ETI threshold are depicted as squares. The three alleles which show qualitatively different ETI profiles, as determined by growth assays in Fig 2, as depicted as diamonds. All other alleles are depicted as circles. Detailed data is presented in S2 Table. (B) The distribution of delta disease scores (PmaES4326 disease score—PtoDC3000 disease score) for all T3SE alleles that elicit ETI in at least one pathogenic background.
