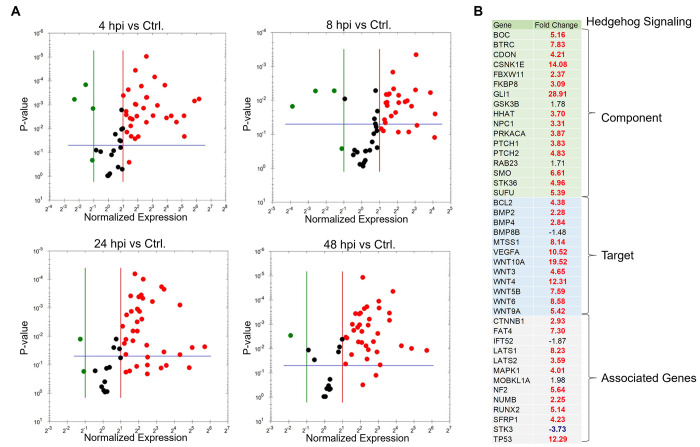
Fig 5. Expression array analysis of Hh-signaling genes during E. chaffeensis infection.
(A) Volcano plots showing the differential expression of Hh-signaling pathway genes between E. chaffeensis-infected (MOI 100) and uninfected THP-1 cells at 4 h (top left), 8 h (top right), 24 h (bottom left) and 48 hpi (bottom right). The red, black and green dots in the volcano plot represent upregulation (≥ 2), no change, and down-regulation (≤ -2), respectively. The horizontal blue lines on the volcano plots determine the level of significance (≤ 0.05). Genes were significantly upregulated at all time points. (B) Normalized expression of Hh array genes in component, target and associated gene categories between E. chaffeensis-infected and uninfected cells at 48 hpi. Cells were harvested with three biological and technical replicates for all time points.

