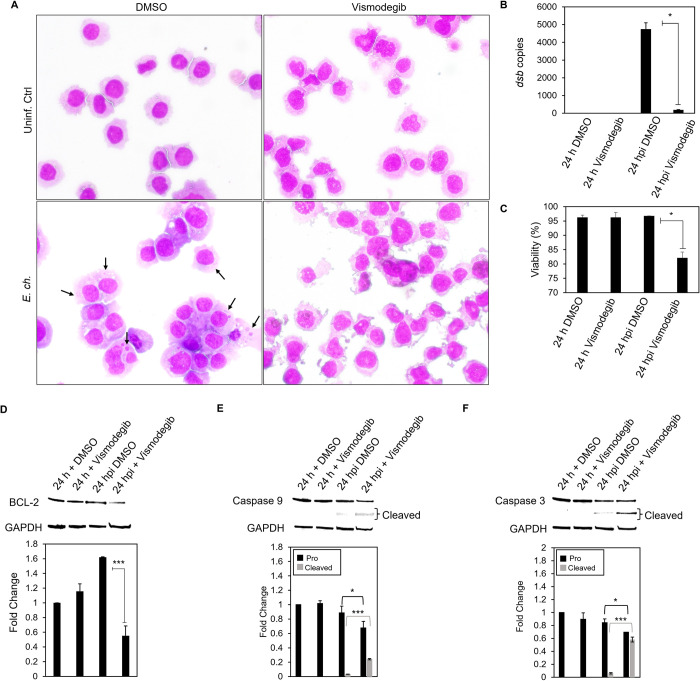
Fig 12. Apoptotic profile is induced in the presence of Hh inhibitor during E. chaffeensis infection.
(A) Brightfield micrographs showing effects of DMSO or Hh inhibitor Vismodegib on uninfected and E. chaffeensis infected THP-1 (MOI 50) cells prepared using Diff-Quick staining. THP-1 cells were treated with Vismodegib or DMSO (200 nM) and infected with E. chaffeensis or uninfected for 24 h. Infected THP-1 cells treated with Vismodegib undergo cytoplasmic condensation (precursor to apoptosis), but other treatment groups do not (arrows point to morulae). (B) Bar graph showing fold-change in E. chaffeensis infection for each treatment group. Ehrlichial loads were determined using qPCR measurement of dsb copy and normalized with host cell GAPDH. E. chaffeensis infection significantly declines in the presence of Vismodegib. (C) Bar graphs showing cell viability for each treatment group. Cell viability was determined using the Cellometer Mini bright field imaging and pattern-recognition assay. Cell viability significantly declines in the presence of Vismodegib during E. chaffeensis infection. (D) Western blot analysis of BCL-2 levels for each group with GAPDH as a loading control. BCL-2 protein expression significantly declines during E. chaffeensis infection in the presence of Vismodegib. (E) Western blot analysis of pro and cleaved caspase 9 levels for each group with GAPDH as a loading control. Pro caspase 9 protein expression significantly declines while cleaved caspase 9 protein expression significantly increases during E. chaffeensis infection in the presence of Vismodegib. (F) Western blot analysis of pro and cleaved caspase 3 levels for each group with GAPDH as a loading control. pro caspase 3 protein expression significantly declines while cleaved caspase 3 protein expression significantly increases during E. chaffeensis infection in the presence of Vismodegib. (D-F) Bar graphs depict Western blot densitometry values normalized to GAPDH. (B-F) (A-F) Experiments were performed with at least three biological and technical replicates and significance was determined through t-test analysis. Data are represented as means ± SD (*p<0.05; **p<0.01; ***p<0.001).

