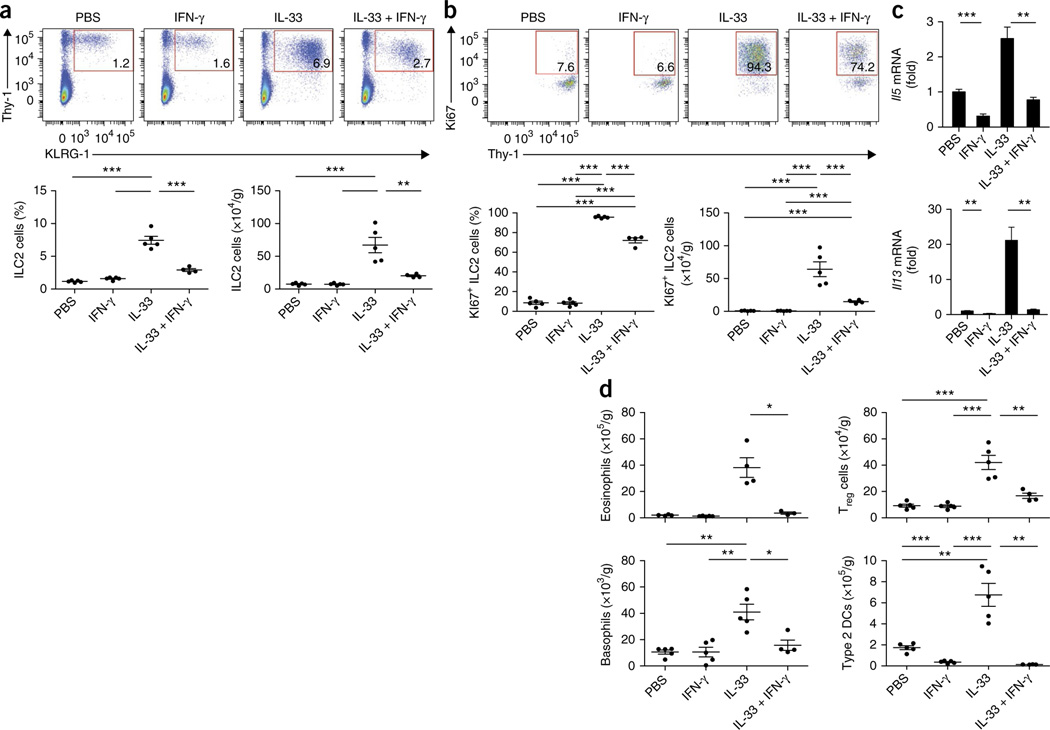
Figure 8.
IFN-γ restricts ILC2 cells and type 2 immunopathology in vivo. (a) Flow cytometry (top) of lung cells from wild-type mice challenged intranasally for three consecutive days with PBS, IFN-γ, IL-33, or IL-33 plus IFN-γ (above plots), assessed 24 h after the final treatment. Numbers in outlined areas indicate percent Lin−KLRG1+Thy-1+ ILC2 cells. Below, frequency (left) and total number (right) of ILC2 cells as above (n = 4–5 mice per group; age and sex matched). (b) Flow cytometry (top) of lung cells from mice as in a. Numbers in outlined areas indicate percent Ki67+ ILC2 cells. Below, frequency (left) and total number (right) of Ki67+ ILC2 cells as above. (c) Quantitative RT-PCR analysis of Il5 and Il13 mRNA in lung cells from mice as in a (presented as in Fig. 1f,g). (d) Total eosinophils, basophils, type 2 DCs and Treg cells in mice as in a, assessed by flow cytometry. Each symbol (a,b,d) represents an individual mouse; small horizontal lines indicate the mean (± s.d.). *P ≤ 0.05, **P ≤ 0.01 and ***P ≤ 0.001 (Mann-Whitney test). Data are representative of two independent experiments (mean and s.d. in c).

