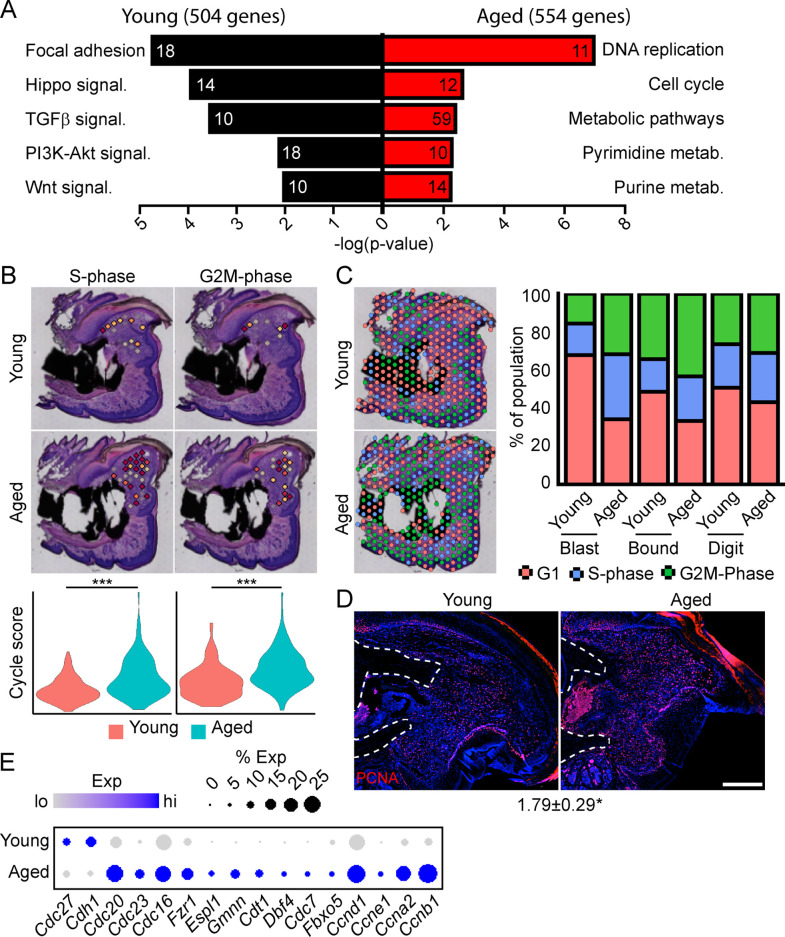
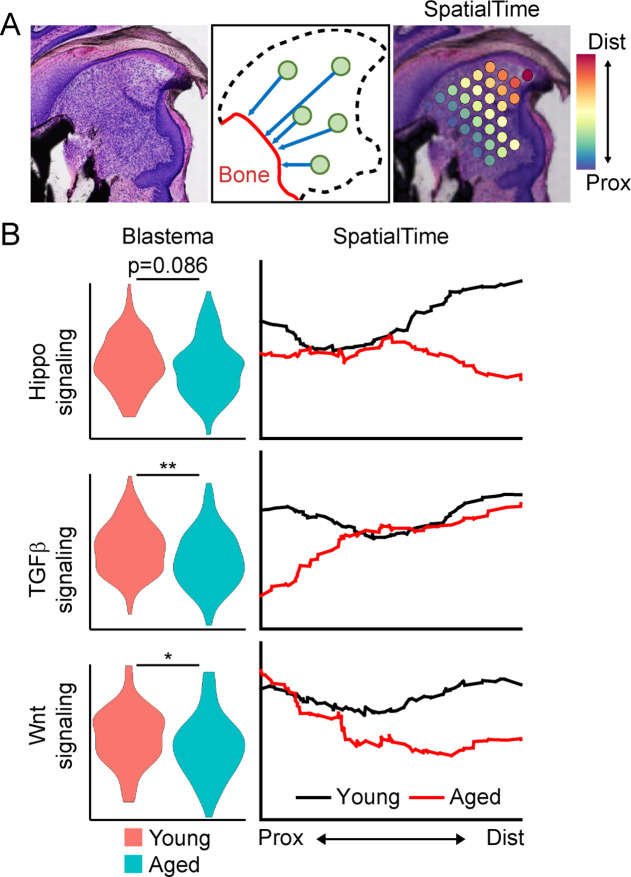
Figure 3. Spatial transcriptomics reveals altered cellular metabolism in aged mice.
(A) Pathway analysis of blastema genes showing differential expression between the young and aged blastema. Number at end of bar denotes the number of significantly regulated genes assigned to each indicated gene ontology (GO term). (B) Spatial and violin plots showing S-phase and G2M-phase cell cycle scoring in the blastemas of young and aged mice. (C) Cumulative distribution of indicated cell cycle phase assignment for each region of the digit. (D) PCNA immunofluorescence in young and aged blastemas. n=3–4. Numbers below image represent the ratio of PCNA-positive nuclei ± SD in aged blastemas relative to young, with values over 1 indicating increased proliferation in aged blastema. Scale bar, 200 µm. (E) Dot plot showing relative expression of cell cycle progression genes in young and aged spatial blastema. Values represent average values ± SD. ***p<0.001, *p<0.05.


