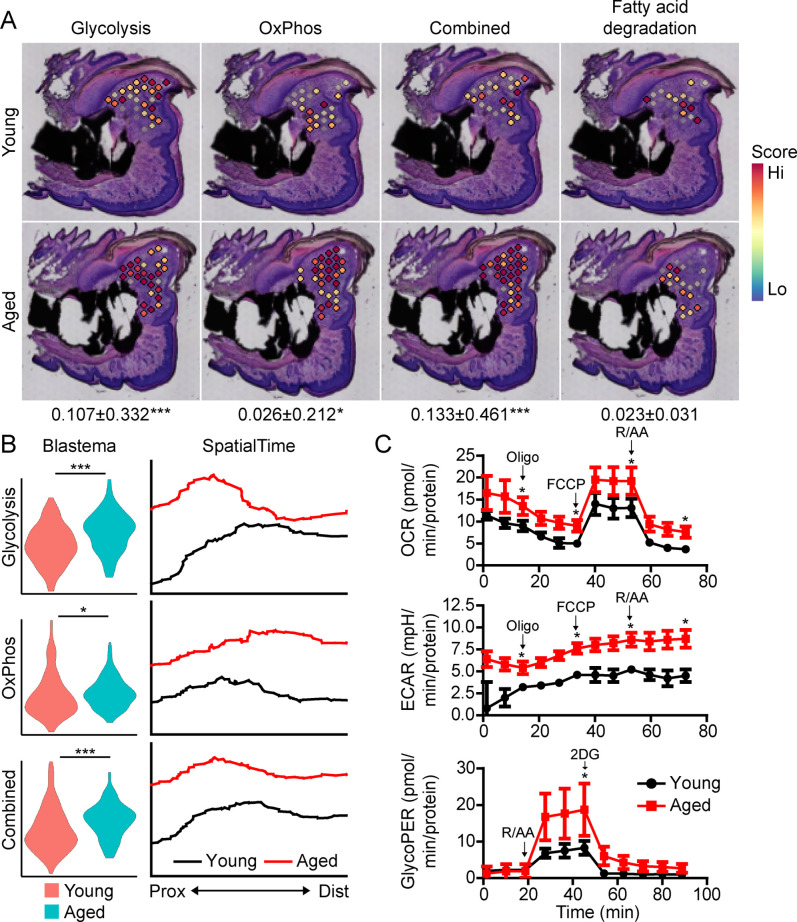
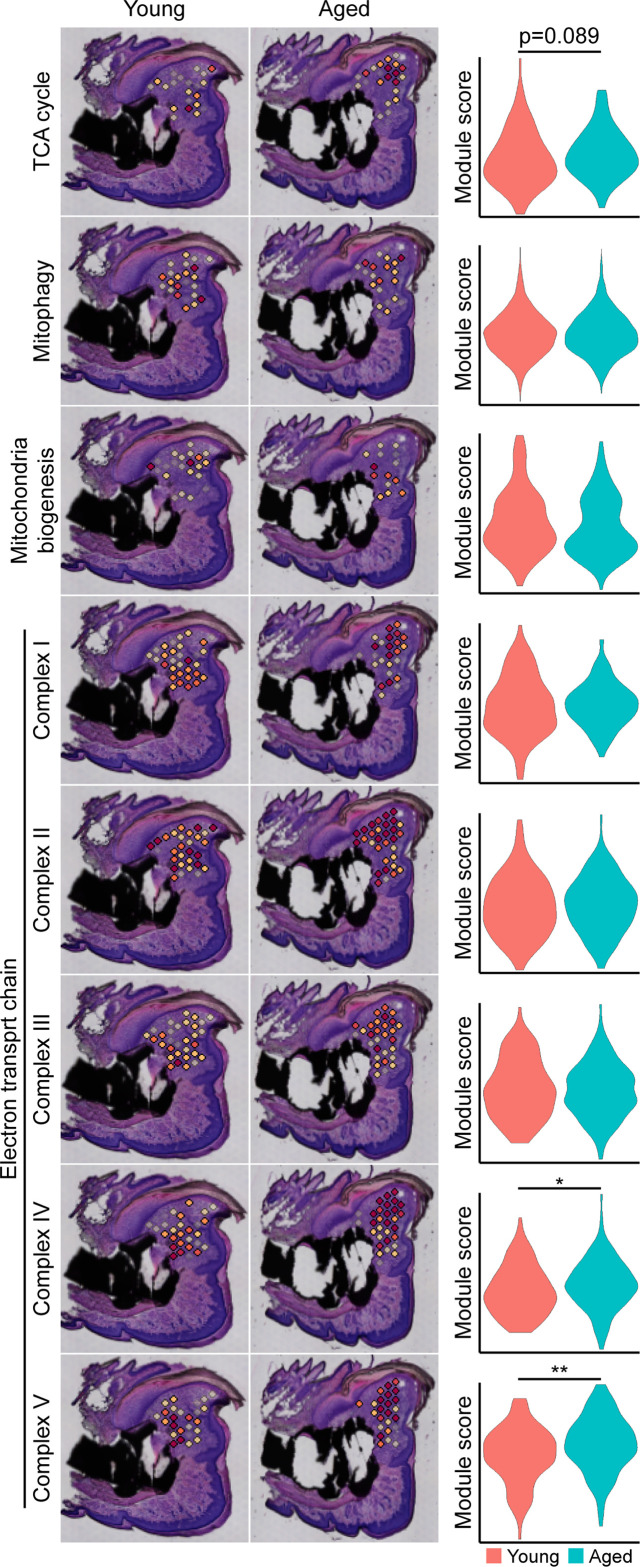
Figure 4. Aged blastemas have increased bioenergetics.
(A) Module scoring for cell metabolism pathways within young and aged blastemas. Combined is the cumulative module scoring values of glycolysis and oxidative phosphorylation (OxPhos). Values below images indicate difference in spatial spot module score within pooled blastema of aged vs. young mice ± SD, with values above 0 indicating increased activation in aged blastema. (B) Violin (left) and SpatialTime plot showing metabolic module score. Prox, proximal; Dist, distal. (C) Seahorse Mito Stress Test (oxygen consumption rate, OCR; extracellular acidification rate, ECAR) and Glycolytic Rate Assay (glycolygic proton efflux rate, GlycoPER) of dissected blastema from young and aged mice (Oligo, oligomycin; R/AA, rotenone/antimycin A). n=8–9 mice. Graphs represent average values ± SEM. *p<0.05, ***p<0.001.


