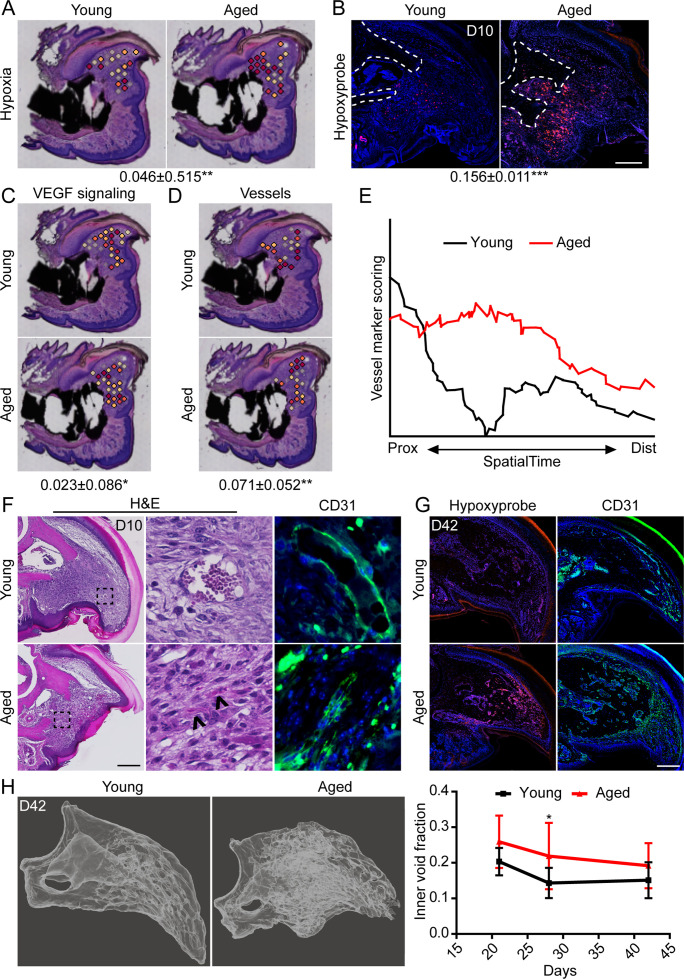
Figure 5. Increased intracellular hypoxia and vascularization in aged mice.
(A) Spatial module scoring of hypoxia-related transcripts. (B) Hypoxyprobe staining in young and aged blastema. Scale bar, 100 µm. Dotted lines indicate the P3 cortical bone stump. (C) Spatial module scoring of vascular endothelial growth factor (VEGF) signaling. (D) Spatial module scoring of vascular markers. Values below images indicate difference in spatial spot module score or hypoxyprobe fluorescent intensity within pooled blastema of aged minus young mice ± SD, with values above 0 indicating increased activation in aged blastema. (E) SpatialTime analysis of the vascular module score from the proximal (residual bone stump) to distal blastema tip in young and aged mice. (F) Hematoxylin and eosin (H&E) staining and immunofluorescent imaging of CD31 showing increased vascularization within the blastema of aged mice at day 10. Scale bar, 100 µm. Arrow heads denote immature vessels. (G) Hypoxyprobe and CD31 staining of digits at day 42. Scale bar, 250 µm. (H) Micro-computed tomography (micro-CT)-based inner void calculations within the regenerated digit. Graphs represent average values ± SD. n=4–6 samples/condition. *p<0.05, **p<0.01, ***p<0.001.

