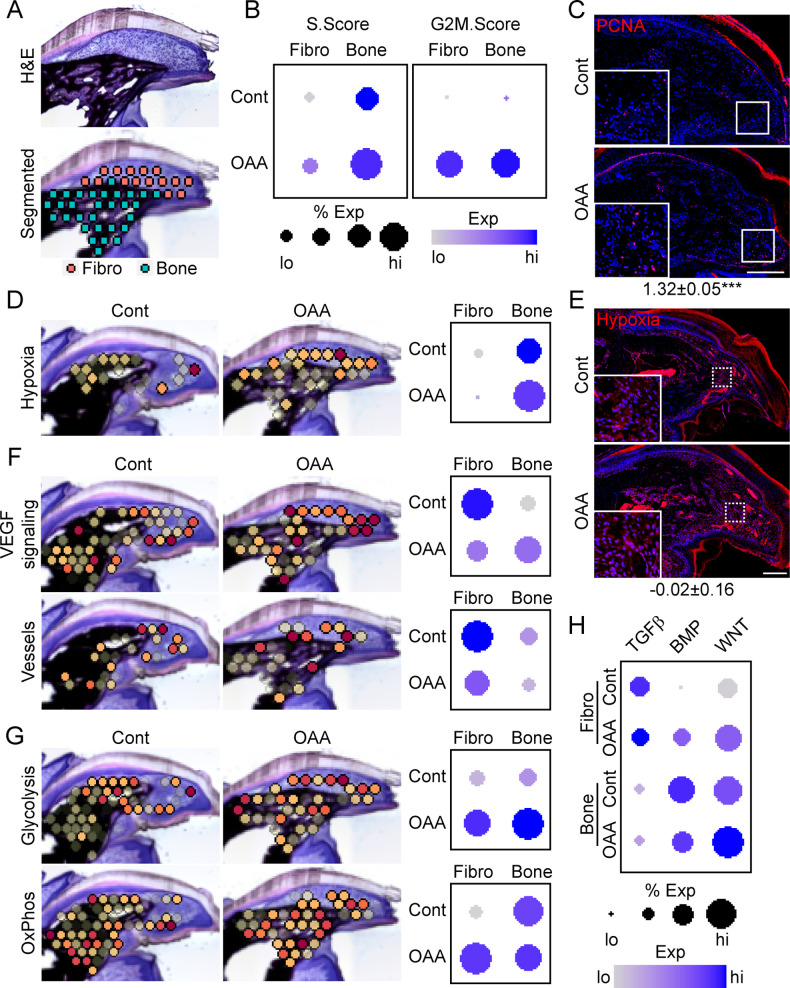
Figure 7. Oxaloacetate (OAA) treatment promotes proliferation and WNT signaling.
(A) Aged mice treated daily with OAA from D10 were sacrificed at D21 and subjected to spatial transcriptomics and the regenerated digit divided into fibroblast (fibro) and bone areas. (B) S- and G2M-phase scoring of aged mice treated with OAA or saline controls (Cont). (C) PCNA immunofluorescence in OAA-treated aged mice vs. saline controls (D21). n=3. Numbers below image represent the ratio of PCNA-positive nuclei ± SD in aged mice treated with OAA relative to saline control, with values over 1 indicating increased proliferation in aged blastema. Scale bar, 200 µm. (D) Spatial and dot plots showing module scoring of hypoxia pathway activation. (E) Hypoxia as assessed by Hypoxyprobe immunofluorescence (D21). Values below images indicate difference in Hypoxyprobe fluorescent intensity within the regenerated digits of aged mice treated with OAA or saline control ± SD, with values below 0 indicating decreased activation in OAA-treated digits. Scale bar, 200 µm. (F) Spatial and dot plots showing module scoring of vascular endothelial growth factor (VEGF) signaling activation and vessel markers. (G) Spatial and dot plots showing module scoring of glycolysis and oxidative phosphorylation (OxPhos) activation. (H) Dot plots showing module scoring of transforming growth factor beta (TGFβ), BMP, and WNT pathway activation. n=4–7 digits per treatment group.

