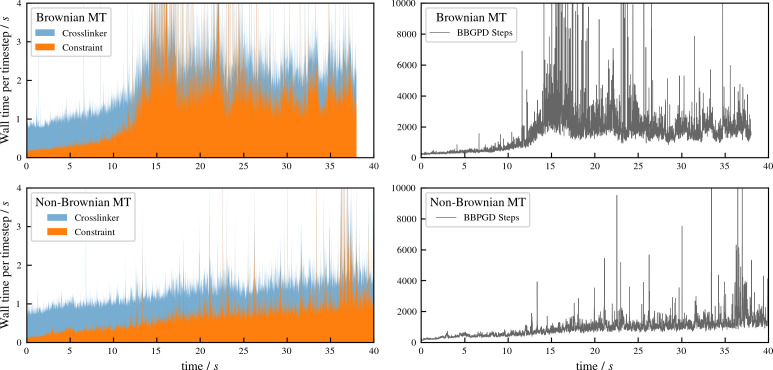
Appendix 4—figure 2. Performance of aLENS for aster formation simulations shown in Figure 7 of main text.
The left panels show the wall clock time that every timestep takes to simulate the Brownian and Non-Brownian cases. The right panels show the number of BBPGD steps to solve the constraint optimization problem at every timestep for those two cases.

