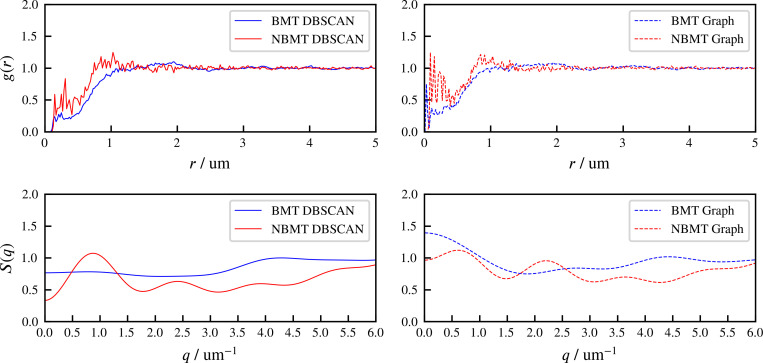
Appendix 5—figure 1. The radial distribution function and structure factor of identified aster centers at steady state, for BMT and NBMT cases.
‘DBSCAN’ and ‘Graph’ refer to two different methods of identifying aster centers, based on spatial locations of all microtubule minus ends, and the crosslinking connectivity, respectively. 500 snapshots at simulation steady state are used to compute and , for each case.

