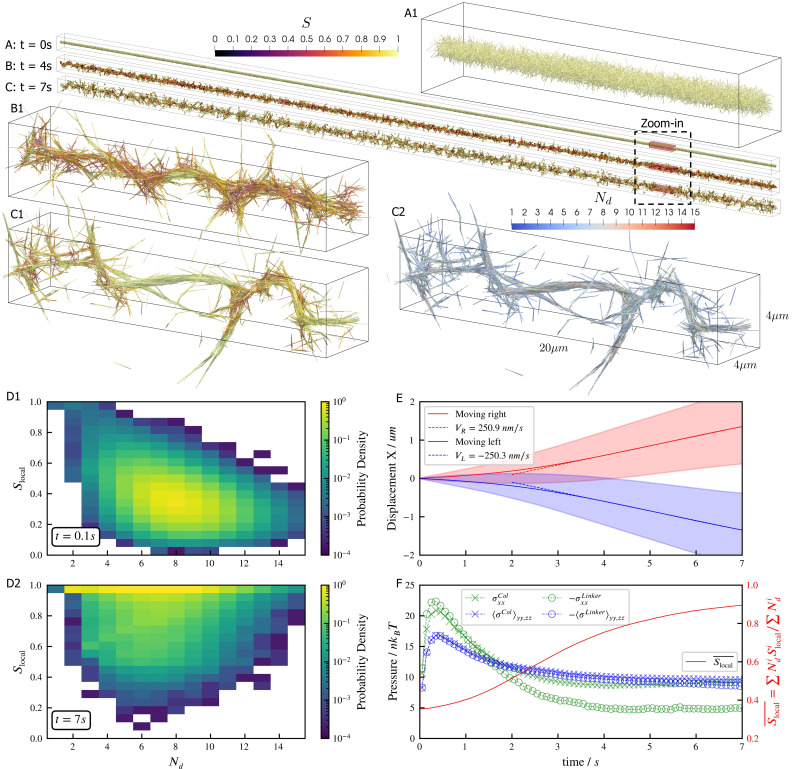
Figure 5. Results for the bundling-buckling simulation of 100,000 microtubules and 500,000 dynein motors in the periodic simulation box of .
Brownian motion of microtubules is turned off. Each dynein has one non-motile head permanently attached to a microtubule and the other motile head walks processively with maximum velocity . If bound, the motile head moves toward the microtubule minus-end, and detaches upon reaching it. Detailed parameters for this motor are tabulated in the Appendix 1. Every microtubule has 5 dynein motors permanently attached to randomly chosen, fixed locations along the length. The initial configuration of microtubules is randomly generated, with their orientations sampled from an isotropic distribution and centers uniformly distributed within a cylinder of length and diameter . The motile heads of all dynein motors are unbound initially. (A, B, C) The bundle at , , and . Microtubules are colored by their local nematic order parameter , with , being the unit orientation vector of each microtubule pointing from the minus to the plus end, and the Kronecker delta tensor. The average is taken over each microtubule plus all microtubules that are directly crosslinked to it by dynein motors. (A1, B1, and C1) Zoom-in views of the small region marked by red box in A, B, and C. (C2) The same region in C1 but colored by , the number of microtubules averaged over when computing . (D1 and D2) The joint probability distributions and for each microtubule for the entire systems at , when the dyneins crosslink microtubules but microtubules barely move from initial configuration, and at , when the bundle is nematic. (E) The average trajectories (solid lines) and their standard deviation (shaded area) of left-moving and right-moving microtubules. Dashed lines show linear fits to the average trajectory after , with results . (F) The normal stresses and the weighted average over time. Due to the symmetry in the directions, only their average is shown . Collision stress is positive (extensile) and crosslinker stress is negative (contractile). The weighted average .

