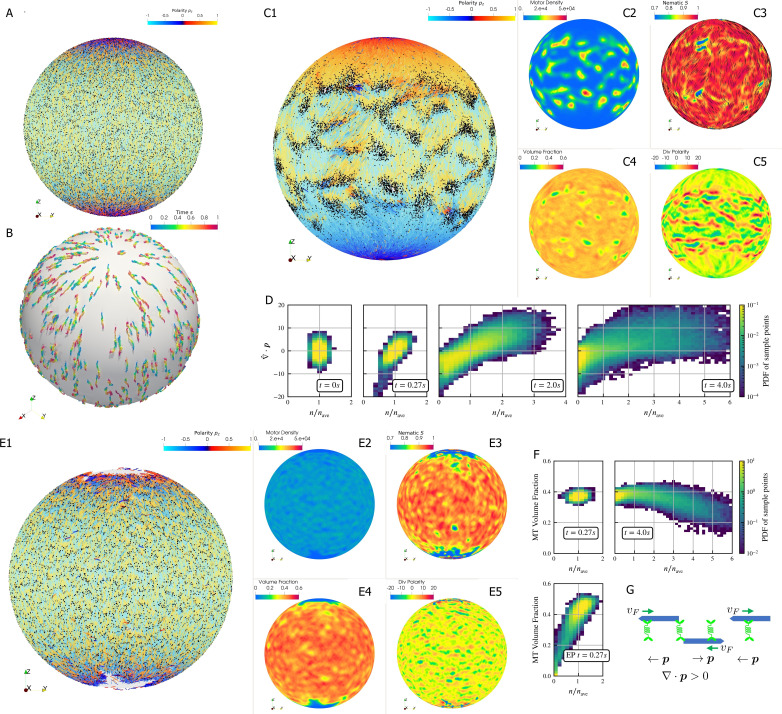
Figure 6. Results for the polarity sorting simulation in a spherical shell.
Initially, 100,000 0.25 µm-long filaments modeling microtubules and 200,000 motors modeling crosslinking kinesin-like proteins are placed between two concentric spherical shells with radii and , to maintain the volume fraction of filaments between these two shells at 40%. Initially, all filaments are evenly distributed on the spherical shell, with their orientation randomly chosen to be either at each point, where is the polar basis norm vector of spherical coordinate system. The pure filament system is relaxed for to resolve the overlaps in the initial configuration. Afterwards at , motors are added to the system homogeneously distributed between the two shells. Sample points are evenly placed to measure the statistics by averaging the volume within from each sample point. (A) The configuration at . Filaments are colored by their polarity, while motors are colored as black dots. Only randomly selected 10% of all motors (same after) are shown in the image to illustrate the distribution. (B) Randomly selected trajectories of filaments from to . Trajectories are colored by time. It is clear that filaments move along the meridians. (C1-C5) Configuration and statistics at . (C1) The filaments and motors. Motors clearly concentrate in some areas. (C2) The motor number density, that is, number of motors per . (C3) The nematic director field (shown as black bars) and the nematic order parameter . (C4) The filament volume fraction. (C5) The divergence of polarity field non-dimensionalized by filament length, that is, change of mean polarity per filament length. (D) The development of the correlation between motor number density and the polarity divergence field, at different times of the simulation. Clearly high are correlated with positive polarity divergence. (E1-E5) Configuration and statistics at for a comparative simulation where motors have end-pausing, arranges in the same style as C1-C5. This case shows significant contraction instead of polarity sorting as filaments are pulled away from the north and south poles and the overall volume fraction significantly increases to approximately 60%. The structure becomes densely packed and does not significantly evolve further. (F) The correlation between motor number density and the local filament volume fraction. For the polarity sorting case at the motor number density correlates with low filament volume fraction. This is not seen in the end pausing (EP) case. (G) A schematic for the correlations shown in D and F.

