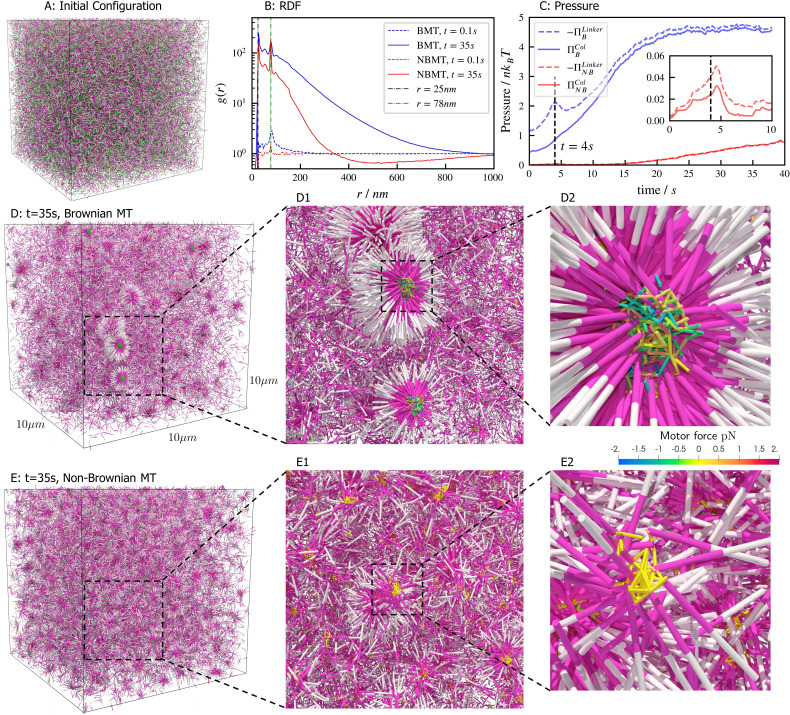
Figure 7. Results for the aster formation simulations with Brownian motion of simulated microtubules turned on (BMT) and off (NBMT).
Initially, 40,000 -long filaments modeling microtubules and 80,000 motors modeling crosslinking kinesin-like proteins are placed in a periodic cubic box of with uniform distribution. Filament orientations are isotropic and motors are all in the unbound state. Motors are assumed to have two minus-end-directed walking heads with symmetric properties. They are assumed to pause when they reach the minus end of filaments until detaching. Detailed parameters are tabulated in Appendix B. (A, D, and E) Simulation snapshots. Each filament is shown as a cylinder colored in half pink (minus end) and half white (plus end). (A) The initial configuration for both NMT and BNMT cases. Each motor is colored as a green dot. (D and E) The snapshot for both cases at . D1-2 and E1-2 Expanded views of a aster core for D and E. Only doubly bound motors are shown in D and E (in green color), and in D1-2 and E1-2 (colored by the spring force). Negative values mean the crosslink forces are contractile (attractive). (B) The radial distribution function (RDF) for the minus ends of all filaments at (dashed lines) and (solid lines). The first peak of at corresponds to close contacts between filaments. The second peak of at corresponds to the minus ends of filaments crosslinked by motors whose rest length is . Blue and red lines are results for the BMT and NBMT cases, respectively. (C) The collision (solid) and crosslinker (dashed) pressure for BMT (blue) and NBMT (red) cases. Pressure is defined as the trace of the stress tensor: . The collision pressure is positive (extensile), and the motor pressure is negative (contractile). The inset plot shows the pressure for the NBMT case in the initial stage of the simulation. The black dashed lines mark the time .

