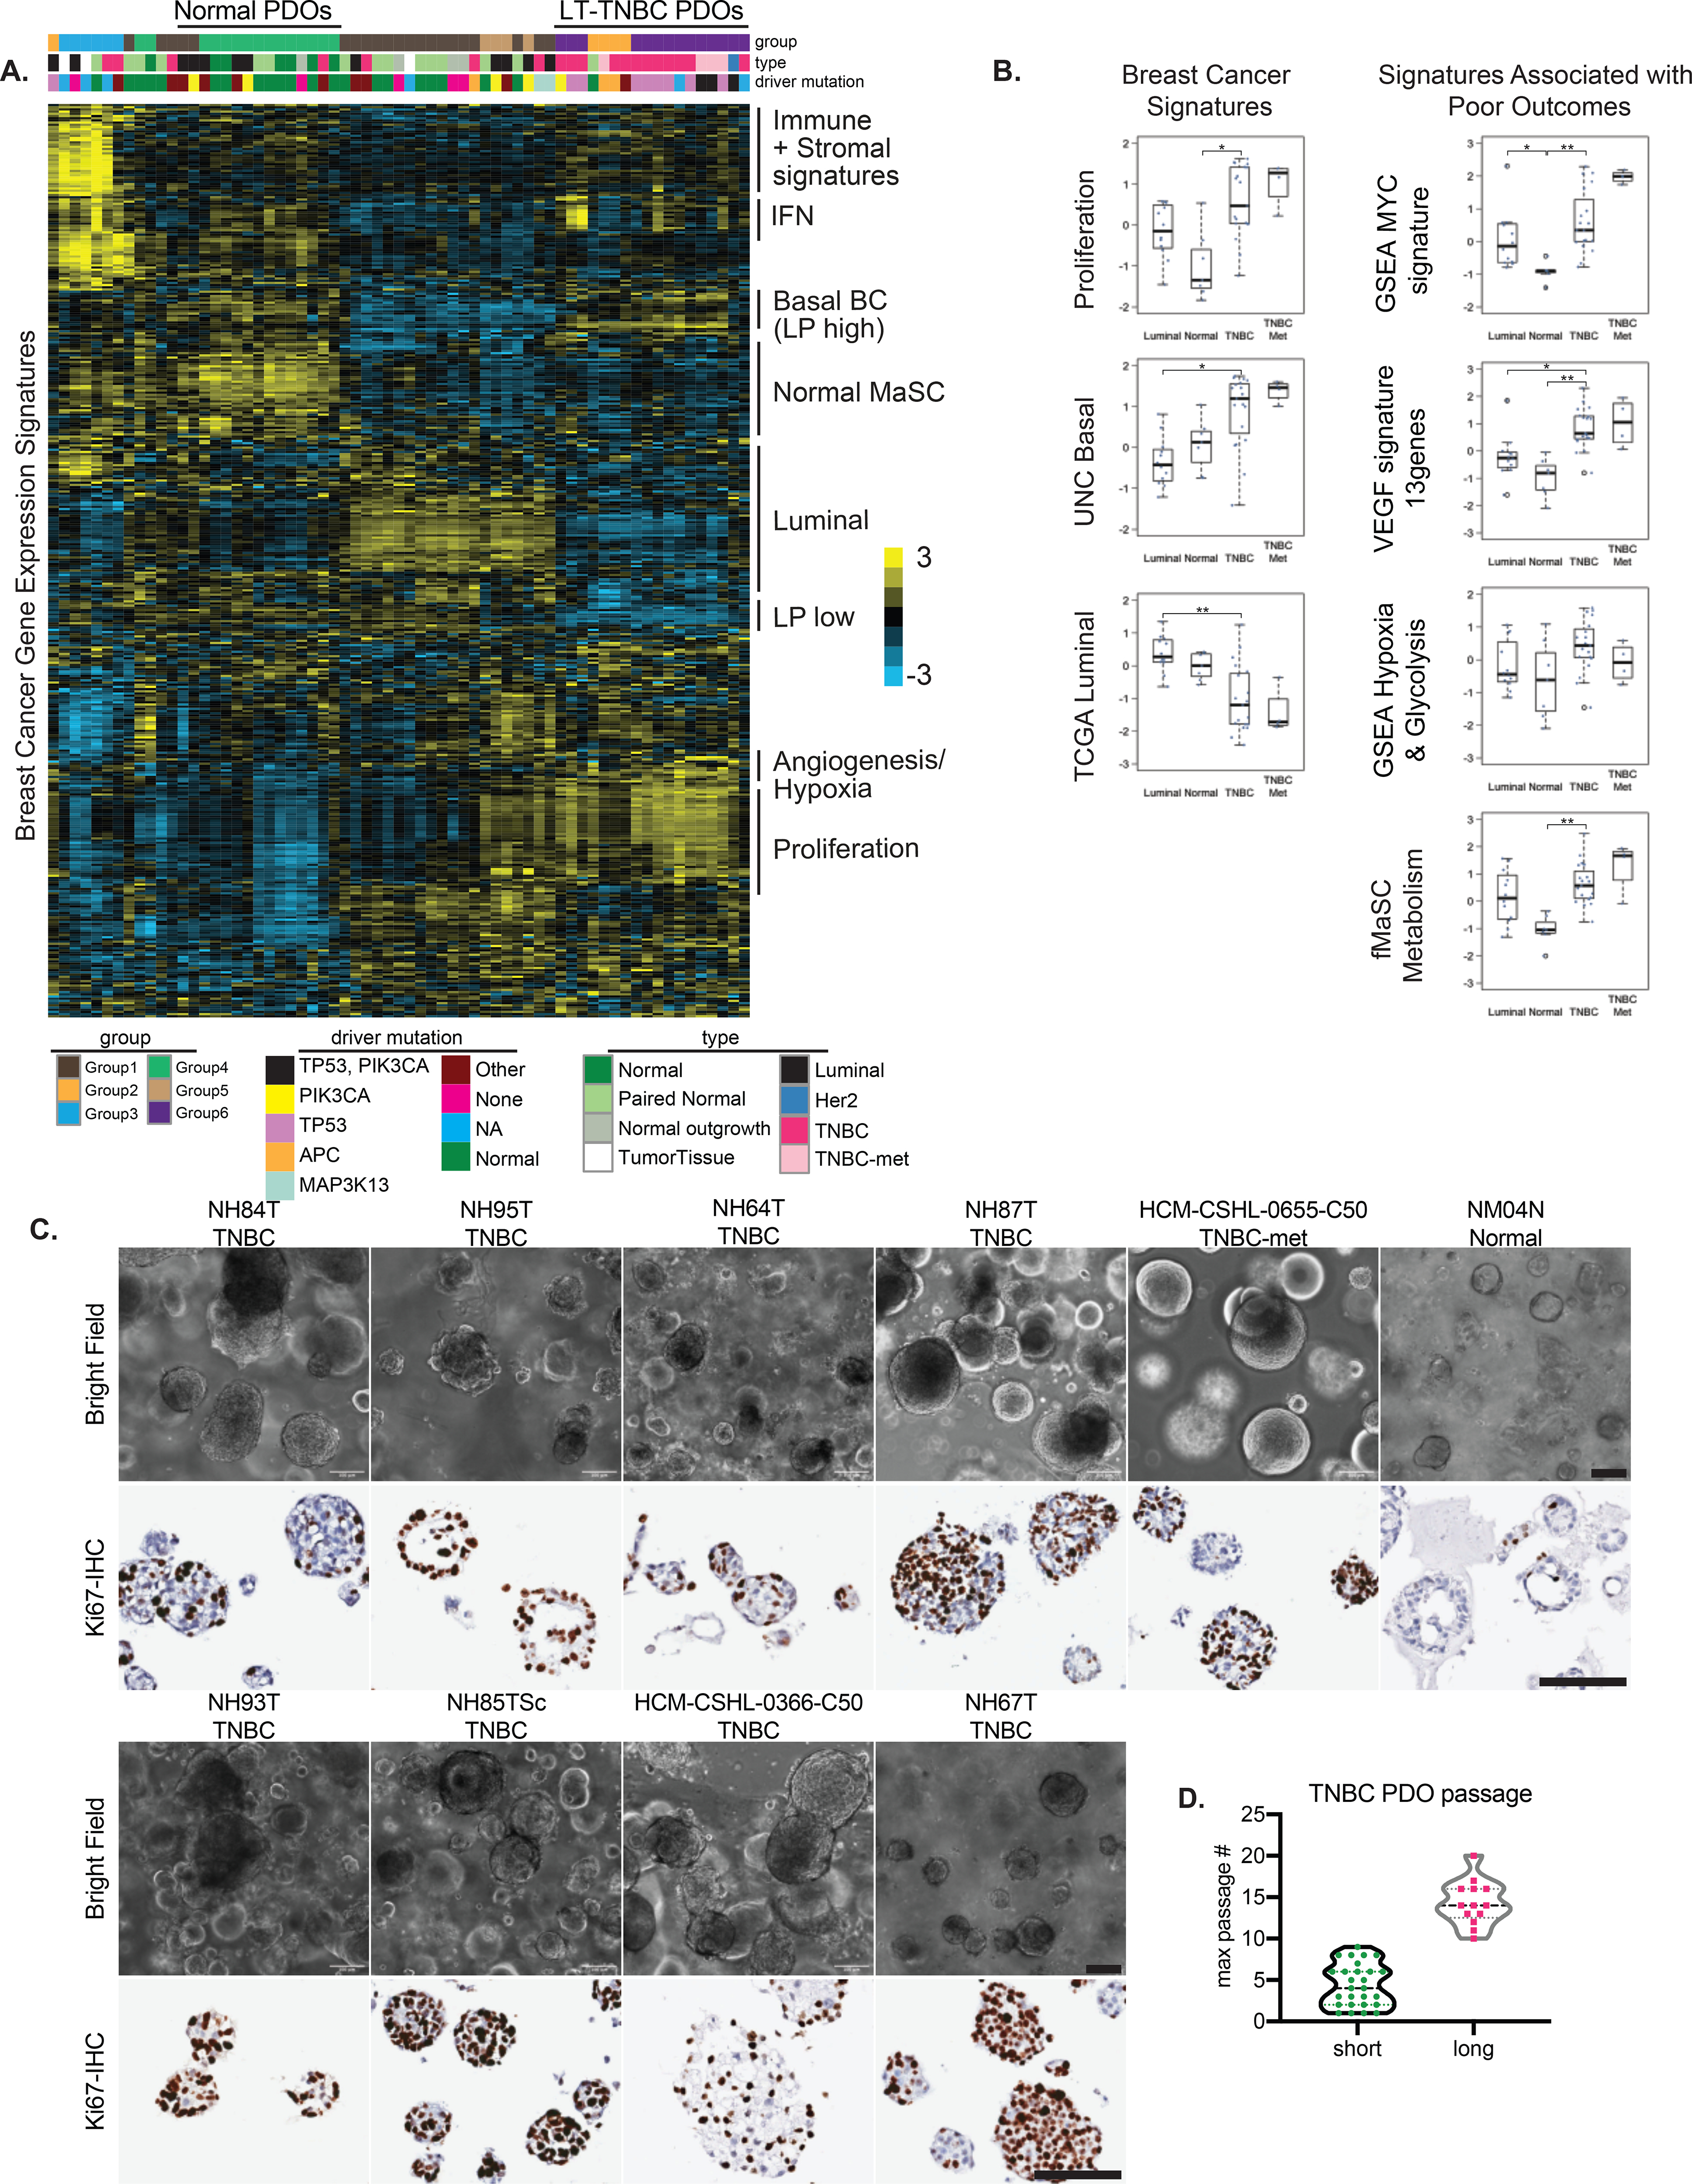
Figure 3. A subset of TNBC organoids recapitulate signatures of aggressive basal-like breast cancers.

A.) Molecular signatures associated with the different organoid lines. The sample legends are type: Normal= reductive mammoplasty derived normal organoids, Paired Normal= Adjacent or Distal to the tumor paired normal, Normal outgrowth= no pathogenic mutations were found, Luminal= ER/PR+ organoids; driver mutation: Other= trace mutations (see Fig 1E), None= no pathogenic mutations were found, NA= not assessed B.) Box-plots showing the breast cancer related and TNBC-specific scores for various gene signatures associated with poor outcomes. Each dot represents a different PDO; Luminal N=12, Normal N= 7, TNBC N= 19, TNBC met= 4. Differences in experimental groups were compared using Kruskal-Wallis test followed by pairwise comparisons using Wilcoxon rank-sum test. Bonferroni-Holm method was used to adjust the family-wise error (** adjusted p-value < 0.005, * adjusted p-value < 0.05) C.) Light microscopy images of the various TNBC- and normal (NM04N) derived organoid lines, along with Ki67-IHC, scale bars=100μm D.) Distribution of maximum passage numbers tested for the various TNBC PDOs. Long-term cultures (long) are defined by p>10 with continued expansion
