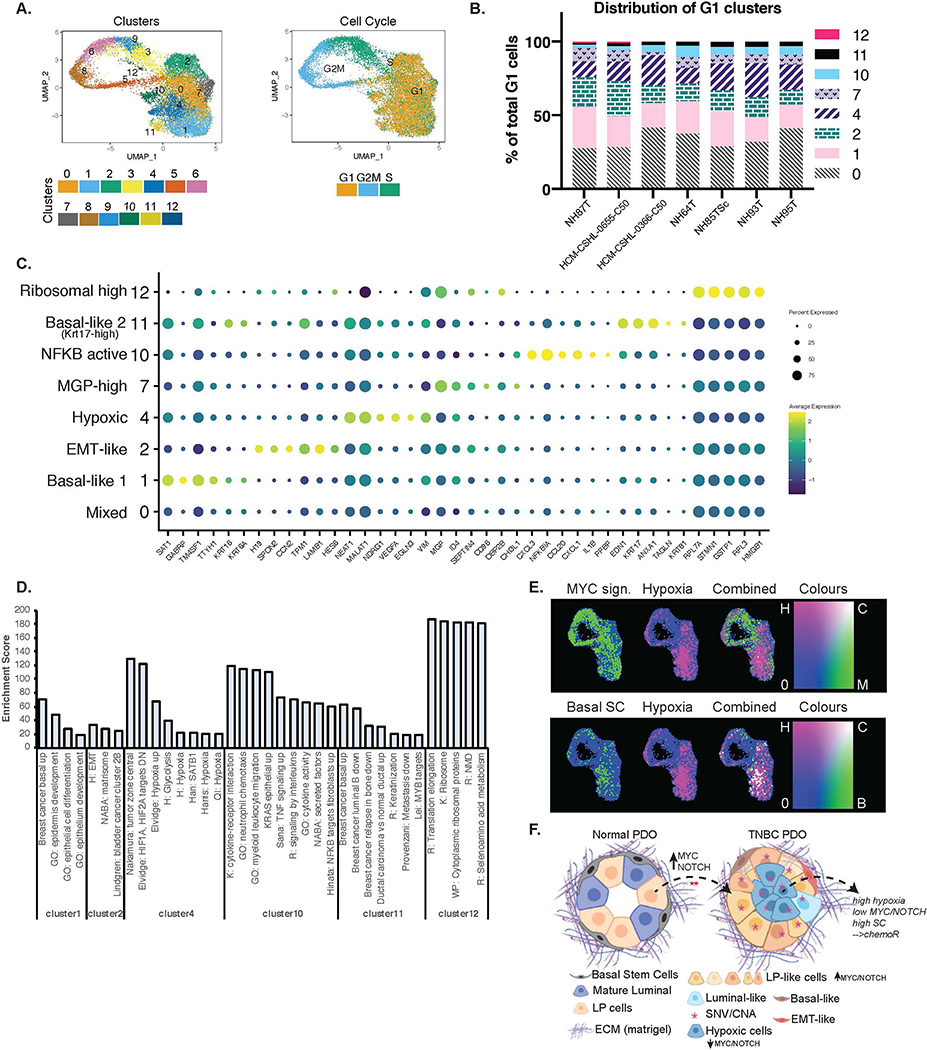
Figure 7. TNBC Organoids are comprised of heterogenous cell populations.
A.) UMAP plot of TNBC only integrated scRNA-seq data showing clusters identified and cell cycle phases. B.) Distribution of cells in each of the G1 clusters identified per organoid line. C.) Dot-plot showing the marker genes for each of the G1 clusters and the associated phenotypic identity of that cell cluster. D.) Enrichment scores from GSEA of each of the G1 clusters that showed strong enrichment of some specific pathways or phenotypes. Enrichment score is represented by −10*NES*padj.value. E.) Combined gene set scores for the various phenotypes. Top panel: green= MYC signature, pink= Hypoxia signature. Bottom panel: green= Basal mammary stem cell (SC) signature, pink= Hypoxia signature. White represents positive correlation of the two signatures. F.) Schematic (created using BioRender.com) showing the cellular composition and heterogeneity observed in normal vs TNBC PDOs when cultured in matrigel. TNBC PDOs retain the tumor SNV/CNA profiles, are largely comprised of LP-like cells that might have originated from normal LP cells by the hyperactivation of NOTCH/MYC pathways. TNBC PDOs also have cells with signatures of hypoxia which is anti-correlated with NOTCH/MYC and positively associated with basal mammary stem cell signatures.

